Actian DataFlow is a parallel workflow platform for end-to-end data access, transformation, preparation, and predictive analysis that eliminates performance bottlenecks in your data-intensive applications. Complimentary to the Actian Vector analytic database, DataFlow leverages concurrency, parallelism, and pipelining to accelerate data movement between locations in your data architecture, creating faster results. DataFlow eliminates memory constraints, as well as the need for data movement into specific data stores before analytics are run. DataFlow understands the available resources before breaking up the execution into smaller chunks that can be run in parallel to take maximum advantage of horizontal and vertical scaling.

DataFlow combines the KNIME (open source data mining platform) drag-and-drop visual workflow environment with the underlying Actian DataFlow platform to provide greater control over the entire process of reading the data, performing the transformation and analytic functions, and writing the results.

What’s new in version 6.6.1?

This update to DataFlow certifies new releases of the most popular Hadoop distributions from Apache, Cloudera, Hortonworks, and MapR, as well as improves parallel load features with the most recent releases of Vector for Linux, Windows, and Hadoop. There is also support for five new data types with DataFlow to handle a larger variety of data formats.  Here is the specific list:

  • Added support for Apache Hadoop 3.0.1+.
  • Added support for MapR 6.0.1.
  • Verified Support for MapR 5.2.2.
  • Updated support for Hortonworks HDP 2.6.
  • Updated support for Cloudera CDH 5.15.
  • Updated direct vector loader to work with latest Vector & VectorH (5.0 & 5.1).
  • Added support for 5 new base types: Money, ip4, ip6, uuid, and Intervals (Periods and Durations).
  • Added support for latest AWS authentication library (1.11 previously 1.3).
  • Added support for logical paths in Hadoop.

DataFlow Results:

For data preparation, data onboarding, and ETL use cases, DataFlow can accelerate the process by factors of 20X or more. For one customer who previously required 17 hours to prepare and cleanse data to onboard new customers, DataFlow reduced the time to 43 minutes, almost 24 times faster. Another customer used DataFlow to parallelize and pipeline their data transfer process to reduce their claims processing times from more than 30 hours to just 20 minutes, which is 90 times faster. In a third example DataFlow demonstrated that it could load 500,000 records into an Oracle database in seven seconds, versus a previous runtime of more than 3 minutes. Contact results@actian.com if you are interested in seeing a demonstration.


Blog | Data Architecture | | 2 min read

What is an Operational Data Warehouse? Why Does it Matter?

the next big thing

Data warehouses have been around for decades, and have established themselves as reliable reporting systems with consistent value. They have also evolved into data marts, specialized appliances, and EDW variants to meet emerging needs, but all of these solutions have their drawbacks when it comes to meeting today’s business demands. Some of the common pitfalls to avoid include stale data, slow query performance, long development cycles, and high costs associated with these variants. There is a better approach. An operational data warehouse (ODW) addresses the need for operational data analytics with the characteristics listed below, without any of the pitfalls:

1. Current:
As the demands for organizations to operate in real-time or in the moment increase, data warehouses need to deliver ever more current data. SQL Hadoop databases commonly fail to handle continuous streams of updates as the file system is optimized for infrequent batch updates, with a moving window of historical data. Lack of current data can mean businesses fail to respond to threats and opportunities fast enough to stay competitive.

2. Fast:
Built on an underlying architecture optimized for analytic query performance, requiring little or no tuning in anticipation of certain workloads (like indexing or aggregations), maximizing the variety of workloads it can support.

3. Scalable:
Scales to large data capacities with an economical and flexible storage layer, connecting to a variety of existing legacy and new sources of data.

4. Secure:
Offers multiple data protection mechanisms to meet enterprise security requirements and comply with tough regulatory environments.

5. Flexible:
Offers flexible deployment options, on-premises and multi-cloud options.

6. Robust:
Delivers enterprise-level resiliency and manageability.

Such an ODW solution provides a database system that can deliver near-real-time insights for ad hoc self-service data discovery and analytics using the most current operational data storage.


Blog | Actian Life | | 3 min read

Our Lifeboat Partnership With Cloud, Mobile and IoT Developers

person researching actian products

This week Lifeboat announced their new contract to distribute our Actian product lines through their vast reseller channels as well as direct to their customers. Speaking as the Actian Product Management and Marketing lead for one of those product lines, the Actian Zen Edge database family, this is a major step forward for us. Lifeboat has a broad line card that represents best-of-breed software and hardware vendors that complement Actian Zen for developers, data scientists, database administrators and business analysts. Allow me briefly to explain why Lifeboat’s brand recognition with Developers and other IT professionals is so important to us. We often talk with CxO-level customers and prospects and find them receptive to our offers but increasingly, decision-making around what software to use for data analytics, integration, and management is being made based on the recommendations of Developers who research on sites like StackOverflow, download software online, and play with it in their off-hours.

Whether we’re talking about traditional data center applications or mobile and IoT applications at the Edge, we know that developers are crucial recommenders if not final decision-makers about which software is selected on any given project. They also play a pivotal role as members of larger virtual teams, sharing their findings with project managers, test/verification and QA specialists, security (particularly as DevOps extends to be DevOpsSec), and of course IT operations. With over 250 product lines, Lifeboat’s solutions include offers from world-class companies like Intel Software and Microfocus (formerly HP Software), providing us with an opportunity to insert Actian Zen into the software application lifecycle at each point where data management, integration and analytics are under consideration – first and foremost with developers but also with other virtual team members.

In the past, developers have been mostly concerned with which programming languages, IDEs, and SDKs to use based on things like ease of use, can I set up and use it on my PC or in the Cloud (meaning free or on my credit card without interference from IT), is this an open standard language or tool, does this improve my marketability, etc.  There wasn’t always much thought given to data management; developers assumed that using a file system or writing out to an external and often communal database was just fine.  Meaning for years, unless they were writing in query functions using SQL or specifically developing analytics software or their own ERP system, they weren’t concerned with API’s for embedded data management.  As applications become more intelligent, we see more developers rethinking how they need and go about embedded data management and analytics to support their applications.  Furthermore, as those applications move out to the Edge, they are more likely to touch lower layers of the enterprise architecture in order to manage and react in real-time for mobile and IoT use cases.  Lifeboat has a long history and strong brand association with Developers who are an increasingly important audience for Actian and, in particular, Zen.  The Lifeboat’s position on innovation and disruptive technologies fits with our product line and support of Lifeboat’s mission.


Blog | Insights | | 6 min read

Airplane Mode aka The Cloud Digital Divide

airplane mode 3d rendering

I recently took a last-minute trip from San Francisco to India. The best fare in economy I could find was on a sixteen-hour Air India flight, direct to New Delhi.  I figured I’d get a lot of work done on the flight and, if not, at least I could catch up on movie-watching. Turns out I was zero for two on this as my in-seat entertainment center didn’t work and I couldn’t get much of my work done either – I guess that means I was two for two on being surprised. Don’t get me wrong, I already knew that my flight didn’t have Wi-Fi, but I’ve got a fairly new iPad with 128GB of storage and full-featured Windows and Mac laptops to keep me busy. As I get stopped by the TSA and every equivalent organization, you’d think I’d learn that one device is enough.

My problem on this trip was that many of the files, emails, online podcasts and other cloud-based content I was expecting to be at my fingertips just weren’t. There were multiple reasons for this. My email is in the cloud and I increasingly just double-click on files, view them or push them into iCloud or OneDrive, forgetting to place them on the local system, as it all eventually syncs up. Right? Many of the white papers I read, I don’t bother downloading, as I simply bookmark the direct link to them in PDF on the web. I watch Netflix without ever downloading episodes. And, when I read my beloved New York Times, I click into related articles without ever thinking about the fact I’m being taken back to the Times website.

So, there I was on the flight, trying to work and finding that every other file I needed and therefore tried to access was greyed out or had the two little light blue arrows pointing at each other (computer says no), the key white papers I wanted to read, not downloaded. Oh well, guess I’ll read the Times. Not so fast. All the related articles and the commentary streams on editorials are back in the cloud, now it’s just day-old news. Boring. The epiphany for me is how much I’ve come to depend on cloud-based connectivity and how little I realize how debilitating a lack of connectivity can be. If you think about it, this has all crept up on us over the last three to five years as most end-user applications and content for everything from entertainment to business productivity have moved to the cloud. Or, in other cases, things that either were manual and physical like books or paper-based forms for knowledge workers, now have rich front-end web clients that give you the impression that you have something local when, in fact, you’re just as dependent on the cloud as formerly PC-based apps are now.

How did we get here? When did all these newfound compute resources at my fingertips become essentially set-top boxes that acted as if I hadn’t paid my Cable bill when the Air India flight taxied onto the runway? Simple, cloud has ushered in the model for distributed and virtual resources that have enabled applications to be delivered as virtual services, but we’ve not fully adopted application architectures and design considerations to make the applications distributed as well as virtual. We’ve gone from local apps with local files to cloud-based apps with cloud-based files – all accessed through a web-based app. This makes it easy to maintain stateless use of the application and associated data, easy portability for systems of engagement and simplifies subscription models and strengthens revenue streams for service providers, but it’s not always best for end-users.

I’m old enough to remember in the late nineties and early noughties the phrase “there’s got to be an app for that.” And, I’m thinking that’s exactly what was needed here. An app that I configure on any one of my systems that’s tied to iCloud, OneDrive, Office365, etc. that I could set to trigger on an upcoming trip that would automatically download and sync across my user defined setpoints. For example, all relevant files and online PDFs, back X number of days and all articles downloaded by default would also automatically download the top Y related articles and the first Z commentaries associated with that core article download.  I don’t know if this app exists but it’s essentially a personal application gateway for all applications and associated data in my list of must-haves for that flight. There would be a requirement for the application to have it’s own local persistent datastore that would cache, at a minimum, metadata associated with an apps local files – for example the mirrors to my iCloud and OneDrive stores on my local drives or the calendar data related to my setpoint – but, in other cases, this gateway application would need it’s own local database to fetch from various web URLs or even scrape them out of, say my New York Times app and download them for me.

At first glance, this may look like a one-off crazy idea, a personal travel application gateway. It’s not, instead of the three devices and say 10 apps and websites that I want to cover with this application gateway on the plane, imagine it’s a Smart Home gateway across 10 appliances or a Smart Car gateway across the combined apps in the entertainment center and the car’s motor systems. What I’m getting at is all these local compute resources will need to be leveraged locally if not for the individual app then to optimize use across all these apps by individuals. Folks, we’re going to have to rethink what a gateway is and who it serves. That’s the other epiphany I had on the plane.  The last one was don’t take 16-hour flights without something to help you sleep.


Blog | Insights | | 2 min read

The Top 5 Pitfalls of Traditional Data Warehouses

hybrid cloud technology concept with data warehouses

Over the past two decades, data warehouse solutions have evolved and diverged to address a myriad of use cases. Meanwhile, the pace of business continues to accelerate, making it harder to remain competitive. These new demands can stretch the abilities of traditional data warehouses.

Below are 5 of the common pitfalls that can trip up traditional data warehouses:

Currency

As the demands for organizations to operate in real-time or in the moment increase, data warehouses need to deliver ever more current data. SQL Hadoop databases commonly fail to handle continuous streams of updates as the file system is optimized for infrequent batch updates, with a moving window of historical data. Lack of current data can mean businesses fail to respond to threats and opportunities fast enough to stay competitive.

Security

Ever-tightening privacy regulations such as GDPR and the increasing frequency of data breaches have made security a front-page reputational issue. Low-end databases can lack advanced encryption features for data in flight and at rest. Column-level data masking is an advanced capability many databases lack making this a serious pitfall.

Speed

There are many reasons that an analytics query can be slow. It could be that the DBA did not anticipate it and had not defined a specific index making that database unsuitable for ad-hoc queries. This problem is compounded by the current trend towards citizen data analysts, where users with a limited understanding of the underlying data structures can bring a database to its knees.

Price

As data volumes and data types grow, adding capacity can become expensive. This is especially true of appliance-based solutions such as IBM Netezza where adding capacity can mean buying a bigger appliance. More open Hadoop- and cloud-based solutions that utilize commodity servers and operating systems have become popular to address the cost of the infrastructure, but have other hidden cost issues, such as requiring costly skills and lock-in.

Deployment

Some databases just need a ton of database development and administration skills. Oracle and Teradata fall into this camp. Cloud-based database services address this complexity to some extent, so there is hope.

Every organization has different priorities, so they may order these five pitfalls differently. Stay tuned for my next blog in the series on “What is an Operational Data Warehouse and Why is it the Next Big Thing?”, where I describe the next big thing in the data analytics, their benefits and much more.


We all hear about how forward-thinking companies, small and large, need to be more customer-focused, even customer-obsessed, to be successful in this hyper-competitive world. Data drives knowledge about your customers’ needs and behaviors, so you can actively tailor your messaging and offers to rise above the competition and win their business. This knowledge comes from an increasing variety of 24/7 sources, through digital systems and increasingly a sea of sensors, devices and mobile applications that track those activities. But the volume of data can be overwhelming, and the value of your data can decay quickly with time, so it’s imperative to have an infrastructure in place to rapidly exploit that perishable information to influence when and how you engage with your intended customers. That takes a new approach to managing data in the moment, which we call an operational data warehouse (ODW). An ODW can go beyond reporting on historic, static data and can instead operate with fresh, active data to drive specific business actions – in the business moment.

Enterprises already have a number of solutions in place to deliver analytic insights, from established relational database systems to enterprise data warehouses to data lakes, within their data centers or increasingly in the cloud. Existing solutions typically involve some significant tradeoffs that an operational data warehouse can overcome.

Take the traditional enterprise data warehouse which has been around for decades. It is an established way of managing historical data, delivering batch updates, supporting regular reporting cycles, and serving as a single source of truth for the corporation. However, it’s typically an expensive solution, especially if you have to upgrade hardware, expand capacity, add new data types, and modernize access. An EDW carefully managed by IT for governance and controlled costs requires new reports to go through a formal change process that can slow development. While an EDW handles planned workloads well, it is poor at ad hoc queries, making it difficult to do data discovery and generate actionable analytics without impacting existing reporting workloads.

Another option for some is an operational data store which provides more data flexibility and a separate environment to allow ad hoc analysis, but usually rigidly focuses on one area or data type and is not comprehensive. Like an EDW, it may not be optimized for interactive analytic query performance needed for discovery.

Data lakes are viewed by many as a more economical and scalable solution, with storage for many data sources and data types. However, it can become a dumping ground for data with poor governance and validation. Its architectural heritage, designed for easy, flexible data ingestion results in turn with slow query performance, subpar user concurrency and unpredictable outcomes.

The latest shiny object to appear is the cloud-only analytics database, promising economical storage and performance and unbounded elastic deployment. In reality, these cloud-only solutions can result in expensive or unpredictable compute costs, limited deployment options with a high potential for vendor/architecture/data lock-in, and relatively new and immature management and tools. Is there a better way?

The ideal solution for operational analytics would have all the best characteristics of the alternatives mentioned above without any of the shortcomings. This new approach would need to be:

  • Fast – It would have an underlying architecture optimized for analytic query performance, requiring little or no tuning in anticipation of certain workloads (like indexing or aggregations), maximizing the variety of workloads it could support.
  • Scalable – It would scale to large data capacities with economical and flexible storage layer, connecting to a variety of existing legacy and new sources of data.
  • Flexible – It would offer flexible deployment options, on-premises or on different cloud platforms.
  • Current – It would be capable of near real-time updates from operational systems to keep current with the business, without slowing down the performance of ongoing analytic queries.
  • Robust – It would deliver enterprise-level security, reliability, and manageability.
  • Secure – It would offer a number of data protection mechanisms to meet enterprise security requirements and comply with tougher regulatory environments.

These characteristics define what we call an operational data warehouse. With such a solution, you would have a database system able to deliver near-real-time insights into the business for a variety of users, from data scientists to business analysts. It would support ad hoc self-service data discovery and analytics using the most current operational data, without burdening transactional systems and workloads.

Actian Vector analytic database was innovated from the ground up to be that operational data warehouse, to harness data in the moment. Not only is it fast, scalable, and flexible, it is ready for production with mature security, administration, and resource management.

Vector is the fastest analytic database available on industry standard servers, on-premises or in the cloud. The original goal was to execute SQL code as fast as if it were written in optimized C code, by taking advantage of the vectorized instructions in standard CPUs as well as a columnar data format to process analytic queries more efficiently. It achieved that goal and more, racking up a number of impressive record-setting benchmark results over the past six years. Moreover, Vector does not need special performance tunings or optimizations like indexing and tuning, providing great performance out of the box. That makes Vector great for ad hoc self-service data discovery, with interactive performance and reduced cycle times for faster iteration, and on full data sets, not samples.

Vector offers scalability from single server to clusters of hundreds of nodes, using Hadoop’s Distributed File System and YARN to manage the resources and distribute the workload to where the data is stored. Vector handles GBs to TBs to PBs of data, and scales to numbers of concurrent users well beyond other MPP solutions.

Vector inherited the administrative infrastructure of Actian’s more established transactional RDBMS products, leveraging the proven maturity of query planning, query optimization, data ingestion, data quality, security, reliability, and manageability. Actian DataFlow perfectly complements Vector by adding faster and more intuitive control over data ingestion and analytic workflows, including a graphical user interface powered by KNIME, which makes it easy to create and optimize query workloads.

Analytics can deliver the best insights with current data, but most analytic solutions expect batch updates and write-once, read-many access patterns that cannot support frequent changes. Vector employs a patented technique called positional delta trees to handle updates to existing data without impacting query performance, resulting in analytics that can incorporate regular and frequent updates to deliver the most current insights into your business.

With the advent of GDPR we’ve seen heightened focus on privacy and security. Vector releases include all the capabilities required to support a GDPR-compliant deployment, and recent additions ease the administration and development of secure solutions. For example, data masking ensures only authorized users can see the underlying data, while others may see only a masked value.

Vector offers a wide range of deployment options, running on industry standard servers under Linux or Windows, and also supporting different Hadoop distributions to scale out on clusters or cloud infrastructure. Vector supports a wide range of storage options as well, reducing any technology lock-ins for your operational data warehouse.

Check out Vector today on the AWS Marketplace and experience what an operational data warehouse from Actian can do for you!


The usefulness of an analytic database is closely tied to its ability to ingest, store, and process vast quantities of data. Data is typically ingested from multiple sources such as operational databases, CSV files, and continuous data streams. In most cases, daily data loads are measured in tens or hundreds of millions of rows, so the traditional SQL INSERT mechanism is not well-suited for these data volumes.

In this blog post we’ll look at Actian Vector, our columnar database ideally suited for analytic applications, and evaluate a variety of CSV data ingestion options that operate at the required data rates. In future posts, we’ll examine Actian VectorH executing in a Hadoop environment and ingestion from streaming data sources.

The purpose of this exercise is not to benchmark data ingestion performance but to evaluate the relative speed of various methods in the same hardware environment. We’ll evaluate SQL INSERT as a baseline, SQL COPY TABLE, command line vwload, and ETL/workflow tools Pentaho Data Integration (aka Kettle), Talend Open Studio for Data Integration, and Apache NiFi. Talend and Pentaho are traditional ETL tools that have evolved to include a variety of bulk loaders and other so-called big data tools and technologies; both are based on the Eclipse UI. NiFi was open-sourced to the Apache Foundation by the U.S. National Security Agency (NSA) and is a general-purpose tool for automating the flow of data between software systems; it utilizes a web-based user interface.

All three implement some concept of a directed graph with data flowing from one operator to the next with operators executing in parallel. Pentaho and Talend have community and subscription editions while NiFi is open source from Apache.

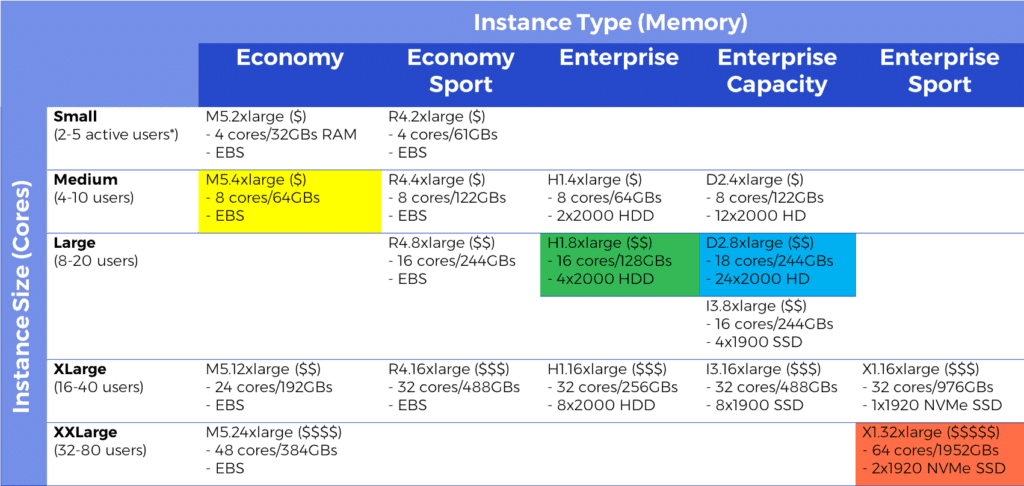
The Vector server is a desktop class AMD Opteron 6234 hex core processor, 64 GB memory and SATA spinning disks (hardware cost ~ $2,500) running single node Vector version 5.0.

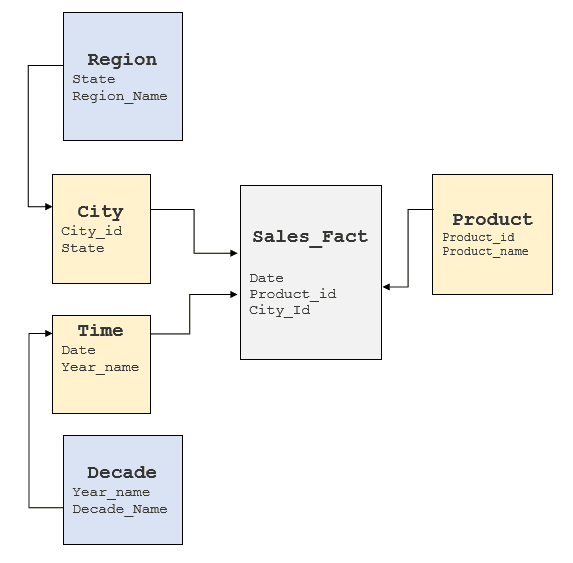
For a basis of comparison, we’ll be inserting approximately 24 million records into the TPCH benchmark lineitem table. The structure of this table is:

l_orderkey bigint NOT NULL,
l_partkey INT NOT NULL,
l_suppkey INT NOT NULL,
l_linenumber INT NOT NULL,
l_quantity NUMERIC(19,2) NOT NULL,
l_extendedprice NUMERIC(19,2) NOT NULL,
l_discount NUMERIC(19,2) NOT NULL,
l_tax NUMERIC(19,2) NOT NULL,
l_returnflag CHAR(1) NOT NULL,
l_linestatus CHAR(1) NOT NULL,
l_shipdate DATE NOT NULL,
l_commitdate DATE NOT NULL,
l_receiptdate DATE NOT NULL,
l_shipinstruct CHAR(25) NOT NULL,
l_shipmode CHAR(10) NOT NULL,
l_comment VARCHAR(44) NOT NULL

SQL INSERT

As Vector is ANSI SQL compliant, perhaps the most obvious ingestion mechanism is the standard SQL INSERT construct. This is generally the least performant option as it results in singleton insert operations. Inserts can be optimized to some extent by making use of parameterization and inserting records in batches, but even that may not provide the level of performance required.

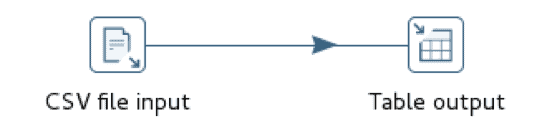
For the SQL INSERT test, we’ll construct a simple Pentaho workflow with two steps, one to read the CSV data file and the other to insert those rows into a Vector database. We’ll also execute the workflow on the same node as the Vector instance as well as a remote node to gauge the effect of network overhead.

SQL insert CSV

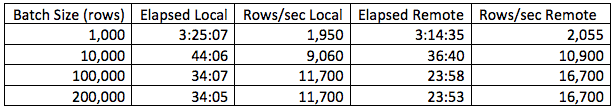
In this situation, loading from a remote node performs marginally better than loading from the local node and performance generally improves with an increasing batch size up to roughly 100K records and then flattens out. This is not to suggest that 100K is always the optimal batch size; it most likely varies based on the row size.

Vector COPY TABLE

The Vector COPY TABLE construct is used to bulk load data from a CSV file into the database. If executed from a remote node, this approach requires a Vector Client Runtime installation, namely Ingres Net and the Ingres SQL terminal monitor. The Client Runtime is freely available and has no licensing requirements. Both Pentaho and Talend have built in support for this construct, although the implementation is slightly different. Pentaho uses named pipes to flow data into the operator while Talend creates an intermediate disk file and then calls the operator.

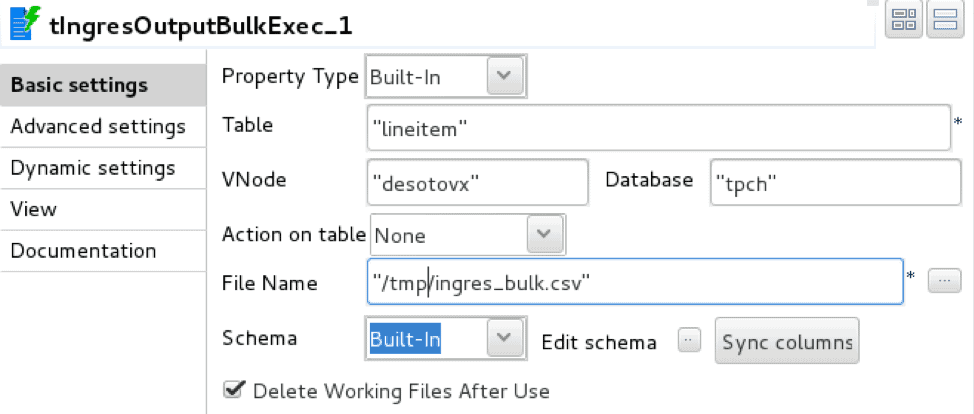
The Talend implementation makes use of two operators, tFileInputDelimited, delimited file reader, and tIngresOutputBulkExec, Ingres/Vector COPY TABLE loader

Talend implementation

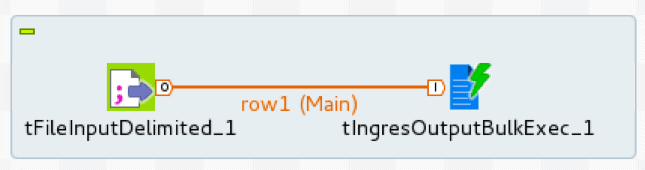
The loader is configured with database connection details, target table, and intermediate staging file.

loader details output

The Pentaho implementation uses two equivalent operators, CSV file input, delimited file reader, and Ingres VectorWise Bulk Loader, database table loader.

pentaho implementation

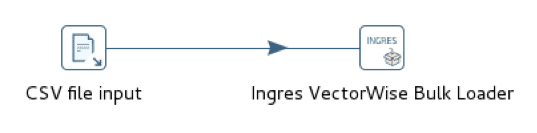
The loader is configured with a Vector connection and target table. Unlike Talend, the Pentaho loader does not use an intermediate staging file.

pentaho loader table

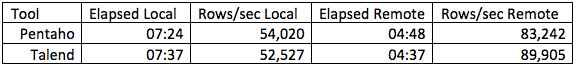
Performance for both tools is essentially the same but on the order of 6x faster than SQL INSERT. Apache NiFi does not provide native Vector COPY TABLE support and simulating this approach by launching the terminal monitor separately and connecting with named pipes is relatively cumbersome.

Vector vwload

The Vector supplied vwload utility is a high-performance bulk loader for both Actian Vector and VectorH. It is a command line utility designed to load one or more files into a Vector or VectorH table from the local filesystem or from HDFS. We’ll explore the HDFS variant in a future post.

Vwload can be invoked standalone or as the data load mechanism for the workflow streams generated by Pentaho, Talend, or NiFi. Pentaho has built-in vwload support while Talend and NiFi provide a mechanism to direct workflow data streams to vwload without first persisting to disk.

The Talend implementation uses the tFileInputDelimited to read the source CSV file and tFileOutputDelimited to write the source file rows to a named pipe. To load the data stream into Vector we need to execute vwload with the same named pipe as the source file.

talend implememtation

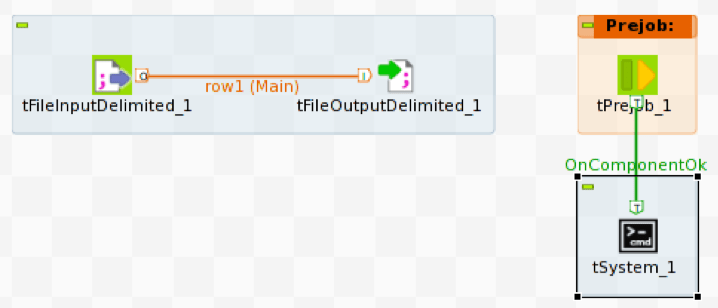
To start vwload we use the Prejob construct to trigger the tSystem operator, tSystem is the mechanism to execute OS level commands or shell scripts. The Prejob operator is triggered automatically at job start before any other workflow operator and is configured to trigger the tSystem operator.

tfileoutput

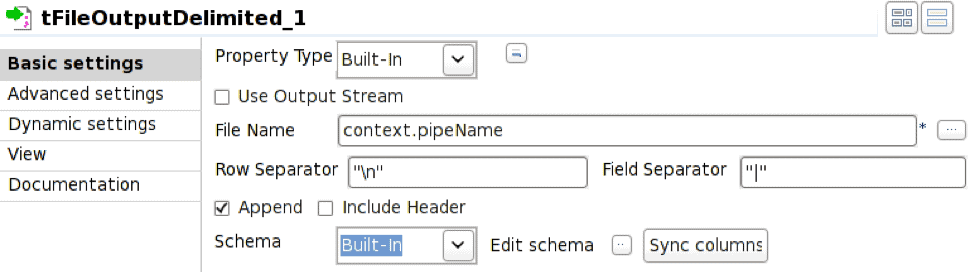
The tFileOutputDelimited operator is configured to write to the named pipe defined by the environment variable context.pipeName. The named pipe must exist at job execution time and Append needs to be checked.

tsystem

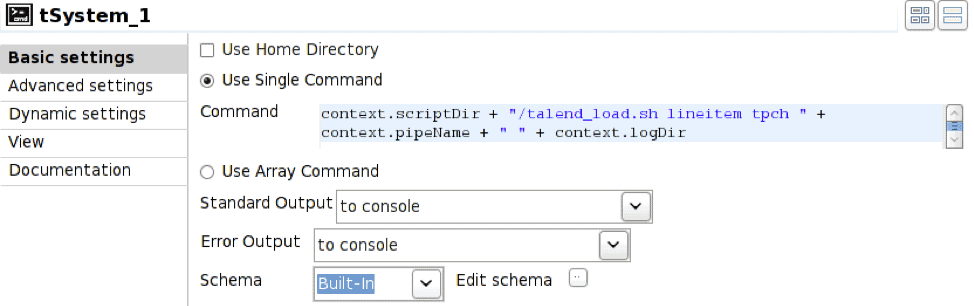
In this case the tSystem operator executes shell script talend_load.sh passing parameters for table name, database name, pipe name, and resulting log file directory. The context. notation is the mechanism for referencing environment variables associated with the job; this allows jobs to be parameterized. The shell script is:

#!/bin/bash
nohup vwload -m -t $1 $2 $3 > $4/log_`date +%Y%m%d_%H%M%S`.log 2>&1 &

The resulting execution sequence is:

  1. Execute Prejob operator
  2. Prejob triggers tSystem operator
  3. tSystem operator executes shell script
  4. Shell script launches vwload in the background and returns; vwload is now reading from the named pipe waiting for rows to arrive
  5. Start tFileInputDelimited to read rows from the source file
  6. Start tFileOutputDelimited to receive incoming rows and write to named pipe

The Pentaho implementation uses the CSV file input and Ingres VectorWise Loader operators as in the COPY TABLE case, but bulk loader is configured to use vwload instead.

ingres vectorwise loader

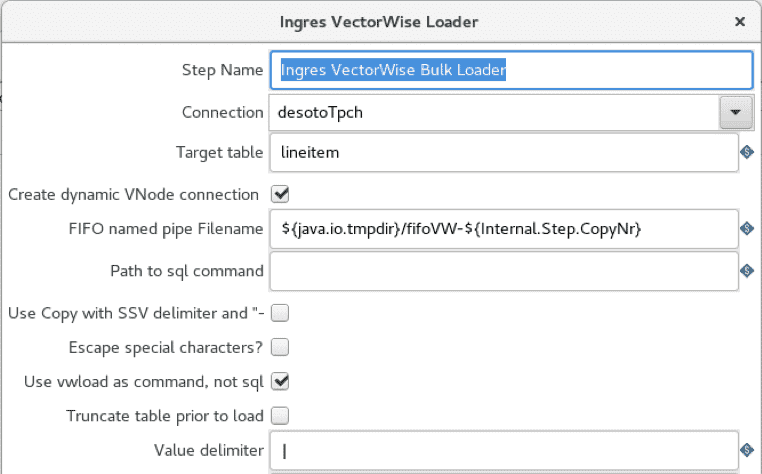
The “use vwload” option is selected, and the “Path to sql command” field is blanked out. This is the way to invoke the vwload utility.

The Apache NiFi implementation makes use of three operators: GetFile, which is a directory listener, FetchFile, which reads the actual file, and ExecuteStreamCommand, which passes the file streaming data to the background vwload process.

apache nifi

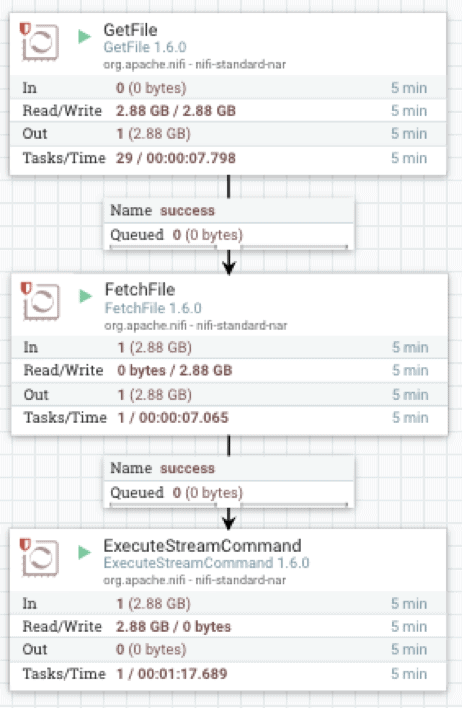
FetchFile feeds the source data stream to ExecuteStreamCommand, which is configured to execute a shell script.

fetch file

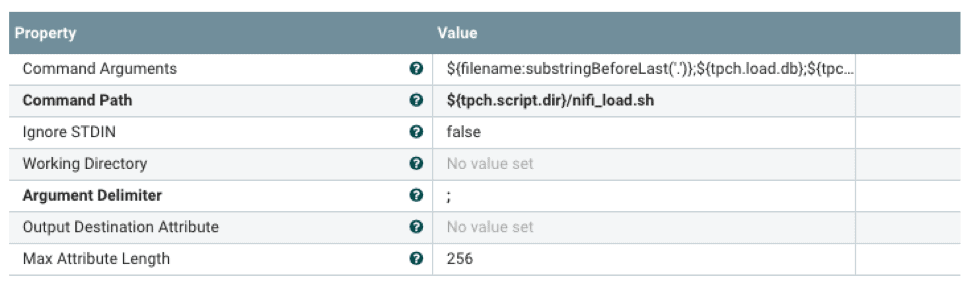
The shell script will launch vwload in the background and direct the data stream to vwload via a named pipe. The ${} notation is the mechanism to reference properties configured with an external properties file. This allows flow processor configuration at runtime.

#!/bin/bash

tableName=$1
dbName=$2
loadPipe=$3
logDir=$4

echo "`date +%Y-%m-%d\ %H:%M:%S` vwload -m -t $tableName db $dbName $loadPipe " 
>> $logDir/load.log
vwload -uactian -m -t $tableName $dbName $loadPipe >> $logDir/load.log 2>&1 &
cat /dev/stdin >>$loadPipe

Command line vwload is used as the load mechanism in the preceding Pentaho, Talend, and NiFi workflows. As a point of comparison, we also load the same dataset using standalone vwload on the local Vector machine as well as from the remote client using Ingres Net.

vwload

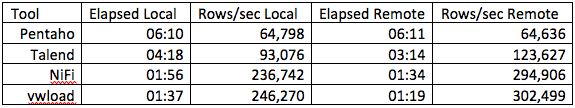
Specific elapsed times and ingestion rates will vary widely based on hardware and row size.

In summary, data ingestion options, in order of increasing performance, are SQL INSERT, SQL COPY TABLE, and vwload. For significant data volumes, vwload used with the appropriate ETL tool is generally the right choice. ETL tool choice is typically driven by performance and functionality. At a minimum, there should be a mechanism to interface with the ingestion method of choice. Functionality requirements are mainly driven by the amount and type of transformation that needs to be performed on the incoming data stream. Even if incoming data is to be loaded as is, an ETL tool can still be useful for incoming file detection, job scheduling, and error reporting.

The workflows above are the trivial case for CSV file ingestion, typically just reading a source data file and loading into Vector. As such they also represent the best-case performance for each of the ingestion methods. Most real-life use cases will involve some degree of transformation logic in the workflow, with data flow rates decreasing as a function of transformation complexity. Measuring the workflow data rates allows us to select the ingestion method that meets those requirements.

Learn More About Actian Vector

You can learn more about Actian Vector by visiting the following resources:

Learn more about our Actian Vector community editions on:


The arrival of Big Data did not simplify how enterprises work with data. The volume, the variety, and the various data storage systems are exploding. With the Big Data revolution, it is even more difficult to answer “primary” questions related to data mapping:

  • What are the most pertinent datasets and tables for my use cases and my organization?
  • Do I have sensitive data? How are they used?
  • Where does my data come from? How have they been transformed?
  • What will be the impacts on my datasets if they are transformed?

So many questions that information systems managers, Data Lab managers, Data Analysts, or even Data Scientists ask themselves to be able to deliver efficient and pertinent data analysis.

Among others, these questions allow enterprises to:

  • Improve data quality: Providing as much information as possible allows users to know if the data is suitable for use.
  • Comply with European regulations (GDPR): mark personal data and the carried-out processes.
  • Make employees more efficient and autonomous in understanding data through graphical and ergonomic data mapping.

To put these into action, companies must build what is called data lineage.


Last week we activated Actian Vector Enterprise Edition on the AWS Marketplace, so now it’s easier to tap into the fastest analytic engine in the cloud to extract insights from your big data. We can prove that claim based on independent benchmarks by MCG that you can view here comparing Vector performance to results from other databases on AWS. Try out Vector on your own data and share your results with us to be eligible for recognition and a giveaway. It takes only three simple steps: 1) choose your instance type, 2) select the right size for your number of users, and 3) pick the pricing plan (hourly or annual) and go!

Instance Types

We are offering Vector on a wide range of EC2 instance types, letting you optimize for cost against performance. Economy types rely on Elastic Block Store (EBS) to separate compute and storage to optimize costs, so you can keep your data in EBS and spin up a Vector instance when you only have occasional demands for analytics. Economy configurations also make it easy to change instance types depending on demand, since the data is managed separately on EBS. Enterprise types optimize query performance by providing local storage, including hard disks, solid-state disks, or even NVMe SSDs, to hold some or all of your data. Sport configurations provide better performance with more memory per core.

Instance Sizes

You can also choose from a choice of instance sizes, starting at 4 physical cores and expanding up to 64. We recommend at least 4 cores for each query running simultaneously, which, given the speed of execution, can cover a significant number of active users, depending on the workload and query complexity.

Let’s look at some examples (the color links back to the chart above):

Pricing Plans

Hourly charges don’t start until after you have the chance to load up your data and experience for yourself how fast and easy it is to use Vector to handle ad hoc queries against large data sets. Performance tuning Actian Vector is easy. No indexing, no materialized views, no special tuning required. Just generate statistics to inform the query optimizer or use autostats to have the statistics generated when the data is first queried.  You can get the lowest hourly rate by signing up for an annual pricing plan, which also entitles you to Enterprise support from Actian once you register.

To learn more, visit our product page here or check out our listing in the AWS Marketplace.


Blog | Insights | | 11 min read

How Actian Vector Helps You Eliminate OLAP Cubes

actian vector graphic for region city time decade sales and product

OLAP (OnLine Analytical Processing) Cubes are used extensively today because many database platforms can’t analyze large volumes of data quickly. This is because most database software does not fully leverage computing power and memory to deliver optimal performance. Some of the symptoms of this are:

  1. Large queries end up hogging server resources.
  2. Response becomes slower as data size and the number of users increases.
  3. Supporting concurrent queries becomes difficult or impossible.
  4. Additional aggregated/materialized tables, indices and sometimes even individual data marts fail to deliver the required performance and concurrency.

OLAP Cube stores were created to solve a BI user’s need to quickly aggregate, slice and dice large amounts of data for a set of pre-determined questions. Now we’ll look at how we can use Actian Vector, our high-speed columnar analytics database, to eliminate the use of OLAP Cubes.

What are the Downsides of Using OLAP Cube Stores?

  1. Additional investment in hardware/software and ongoing maintenance costs.
  2. Completely new skills in Multi-Dimensional Expressions (MDX) are required to query the OLAP Cubes.
  3. Imposes a strict schema (star or snowflake), while some of the newer generation Cube stores support 3NF tables (or ROLAP models). But the best performance is always delivered by having a star schema.
  4. They limit ad-hoc query freedom. A lot of thought needs to go into designing the OLAP Cube. Once it is built, only the rows and columns included will be available for querying. Often, a new Cube is required for every new query.
  5. Adds a significant amount of processing time and creates new bottlenecks to the BI life cycle. The BI user would have to pay heavily in lost time if the OLAP Cube was built incorrectly. Data freshness is compromised as data has to move from operational systems to the data warehouse to the OLAP Cube and then to BI tools.

Looking Under the Hood

Let’s have a look at what you give up with an OLAP Cube.  Here’s a simple example where the raw data in the underlying relational database looks as follows:

Sale _date Year month decade city _id city _name state Region _id Region _name Product _id Product _name Sales _Amount
1/1/1990 1990 January 1990-2000 1 Palo alto CA 1 US-West 1 Bolts 20
1/2/1990 1990 January 1990-2000 1 Palo alto CA 1 US-West 1 Bolts 23
1/3/1990 1990 January 1990-2000 1 Palo alto CA 1 US-West 1 Bolts 15
1/1/1993 1993 January 1990-2000 1 Palo alto CA 1 US-West 2 hammer 14
5/1/1993 1994 May 1990-2000 2 La Jolla CA 2 US-West 3 screws 60
1/1/2003 2003 January 2000-2010 3 Dallas TX 1 US-South 1 Bolts 12
5/1/1993 1993 May 2000-2010 4 Atlanta GA 2 US-South 3 Screws 34
10/1/2004 2004 October 2000-2010 5 New York NY 1 US-east 1 Bolts 35
10/2/2004 2004 November 2000-2010 6 Boston MA 1 US-East 1 Bolts 37
10/3/2004 2004 December 2000-2010 1 Palo Alto CA 1 US-West 1 Bolts 39
10/4/2004 2004 January 2000-2010 1 Palo Alto CA 1 US-West 1 Bolts 42
10/5/2004 2004 February 2000-2010 7 Madison WI 1 US-central 1 Bolts 44
10/6/2004 2004 March 2000-2010 8 Chicago IL 1 US-central 2 hammer 46
4/1/2011 2011 April 2010-2020 9 Salt Lake City UT 2 US-West 3 screws 49
5/2/2012 2012 May 2010-2020 1 Palo Alto CA 2 US-West 1 Bolts 51
6/3/2013 2013 June 2010-2020 2 La Jolla CA 2 US-West 3 Screws 53
7/4/2014 2014 July 2010-2020 10 Jersey City NJ 2 US-East 1 Bolts 56

If a user is interested in creating a simple OLAP Cube for sales from the data above and the metrics of interest aggregated sales_amounts for each decade, year, by product and region, the OLAP Cube would have the following data in it:

Decade Year Region_name Product_name Sales_Amt Avg_Price
1990-2000 1994 US-West Screws $60.00 $19.33
1990-2000 1993 US-South Screws $34.00 $14.00
1990-2000 2003 US-South Bolts $12.00 $60.00
2000-2010 2004 US-central Bolts $44.00 $34.00
2000-2010 2004 US-Central Hammer $46.00 $12.00
2000-2010 2004 US-east Bolts $72.00 $44.00
2000-2010 2004 US-West Bolts $81.00 $46.00
2000-2010 2011 US-West Screws $49.00 $36.00
2010-2020 2012 US-West Bolts $51.00 $40.50
2010-2020 2013 US-West screws $53.00 $49.00
2010-2020 2014 US-east Bolts $56.00 $51.00
2010-2020 1994 US-West Screws $60.00 $53.00


The data is aggregated by Decade, Year, Region_name, Product_name. The transactional level detail is lost. For this reason, some of the more mature OLAP Cube stores offer a drill-through feature allowing the user a look at the detailed data. However, the performance could degrade if the amount of data behind the aggregation is large.

A typical MDX query to get this data from the cube would look like this based on what the user would like to see on rows and columns and data points.

WITH 
MEMBER[measures].[avg price] AS 
'[measures].[sales_amt] / [measures].[sales_num]' 
SELECT 
{[measures].[sales_sum],[measures].[avg price]} ON COLUMNS, 
{[product].members, [year].members} ON ROWS 
FROM SALES_CUBE

The Avg_price is a calculated measure. Note that calculated measures can be specified in the OLAP Cube definition or can be defined in the MDX query. One of the benefits of calculated measures defined in OLAP Cubes is that if the query was changed to have a filter or an additional dimension was added the calculated measure would automatically get recalculated with the new parameters.

And so, the OLAP Cube ends up being a partial fix to a problem – that row-oriented relational databases simply aren’t fast enough for analytic queries.  What would your OLAP users ask for if they could have whatever they want?  What we hear from users are these requirements:

  • OLAP-like speed or better with full ad hoc query support
  • The ability to use any data model they want
  • All their favorite BI tools
  • The most current data available
  • Access to full detail data in the same query, and without trading away any performance

Seem impossible?  It isn’t. Actian Vector can deliver all this and more.  How is that possible?  Read on!

Replacing OLAP Cubes With Vector 

Actian Vector is uniquely positioned to replace OLAP Cubes.  We built it from the ground up with a number of optimizations to dramatically increase the performance of analytic queries.  Here’s a quick summary of what we’ve built:

  • Vector Processing: Vectorization takes parallelization to the next level by sending a single instruction to multiple data points delivering near real-time response.
  • Columnar Storage: Columnar greatly reduces IO by only loading the columns required in a query into memory as opposed to loading all the columns into memory and then picking the required columns required to satisfy the query.
  • Optimized In-Memory: Advanced use of processor cache and main memory, and in-memory compression and decompression speed up the process.
  • Flexibility: Vector works with any data-model – star, snowflake, 3NF and de-normalized eliminating the need to create any type of materialization of data. Since the BI user is working off of the source of data, query freedom is not lost.
  • Functional Richness: Advanced OLAP/Windows functions empower the user to ask a wide array of sophisticated questions.

Moving From Cubes to Actian Vector

To migrate BI reports from OLAP Cubes, it is important to understand the Cube features that need to be migrated. These include:

  • OLAP Cube Model – Understand the data model of the Cube itself and map it back to the RDBMS data model.
  • MDX queries, calculated measures, and filters being used.
  • KPIs – Key Performance Indicators.
  • What-if analysis for different scenarios.

OLAP Cube Model

Examine the OLAP Cube and identify what sort of data model it relies on: ROLAP, HOLAP or MOLAP. ROLAP models rely on third-normal-form (3NF) data-models where the data is highly normalized. Typically, there is a performance penalty when using ROLAP models in Cubes.

HOLAP is a hybrid model where a combination of star or snow-flake models, de-normalized and 3NF is used. This also has performance penalties.

MOLAP is the most desired underlying model where a star or snow-flake data model is used and delivers the best performance. Typically, in a BI lifecycle, the source data is in 3NF and it must go through a long transformation process to get converted to a star schema model. The penalty is paid up-front to gain better performance later.

The following factors need to be examined, if a query is used at the data source:

  1. Dimensions: How is this arrived at in the Cube. Specially for ROLAP and HOLAP models.
  2. Measures: Both calculated and normal measures.
  3. Facts: Is it one single table, a combination of tables?

It is important to examine the above factors to gain an understanding of the underlying RDBMS model to see where these elements can be obtained. Typically, data warehouses have star or snow-flake models implemented but some data warehouses tend to have a highly normalized model. For the Cube above, a typical snow-flake model would look like follows:

SQL schema

Converting MDX Queries to SQL

Examine the MDX query and identify the following elements from the OLAP Cube and MDX query. Refer to a basic MDX tutorial if you need to. Here’s what you’ll need to know:

  1. Dimensions
  2. Measures
  3. Calculated Measures
  4. Slices of data or Filters (Example: If the user wanted to know the sales for only “Bolts” or only for the month of January.)

Taking the MDX query from the prior section as an example:

WITH 
MEMBER[measures].[avg price] AS 
'[measures].[sales_amt] / [measures].[sales_num]' 
SELECT 
{[measures].[sales_sum],[measures].[avg price]} ON COLUMNS, 
{[product].members, [year].members} ON ROWS 
FROM SALES_CUBE

Where:

  • Avg price is a calculated measure
  • Sales_amt is a measure that is defined in the cube
  • [product].members is the product Dimension
  • [Year].members is the year Dimension

Now you want to convert the MDX queries to SQL Queries based on the model above. The MDX query can be rewritten in SQL as below:

Select year_name, product_name, sum(sales_amt) as sales, avg(sales_amt) as avg_sales 
from Sales                FT 
join Time_Dimension        TD       on FT.date = TD.date 
join Month_Dimension    MD     on month(TD.date) = MD.month 
join Year_Dimension         YD       on year(date) = YD.year 
join City_Dimension          RD       on FT.city_id = RD.city_id 
join State_Dimension   SD on FT.state_id= RD.state_id 
join Product PD on FT.product_id = PD.Product_id 
group by year_name, product_name

or, simplify the query even more by removing the dimension tables if they were introduced only to build the Cube:

Select 
date_part(year, sale_date) as year_name, product_name, 
sum(sales_amt) as sales , 
avg(sales_amt). as avg_sales 
from Sales FT 
join Product PD on FT.product_id = PD.Product_id 
group by decade,year_name, region_name, product_name

Note: It is not being implied that joins to other tables can be completely eliminated. Only tables that were introduced simply to adhere to the strict star/snow-flake schema can be eliminated.

If the BI tool does not provide window analytic functions refer to the analytical functions an  window functions provided by Vector so it can be executed in-database.

If the user would like to drill down into a specific set of rows then the aggregation can be removed and the query can be executed in-database. As an example, if the user is interested in drilling into January 1993 sales figures for product Bolts, they could use the following SQL query:

Select 
Date_part(year, sale_date) as year_name, 
product_name, sales_amt as sales 
from Sales    FT 
join Product PD on FT.product_id = PD.Product_id 
where Product_name = “Bolts” 
and Date_part(year, sale_date) = “1993” 
and Date_part(month, sale_date)  = “January”

Key Performance Indicators

In business terminology, a Key Performance Indicator (KPI) is a quantifiable measurement for gauging business success.

A simple KPI object is composed of: basic information, the goal, the actual value achieved, a status value, a trend value, and a folder where the KPI is viewed. Basic information includes the name and description of the KPI. In a Microsoft SQL Server Analysis Services Cube, the goal is an MDX expression that evaluates to a number. The actual value is an MDX expression that evaluates to a number. The status and trend value are MDX expressions that evaluate to a number. The folder is a suggested location for the KPI to be presented to the client.

While some OLAP cube stores do provide elegant and easy to use interfaces to store and implement KPIs and actions, these can easily be implemented by using a combination of more mainstream database features and application code.

What-if Analysis for Different Scenarios

What-if analysis capabilities are provided by some Cube stores with easy-to-use interfaces. This can also be implemented using database features and application code with some effort.

This type of analysis requires storing various scenarios and analyzing the impact of the current state of business against these different scenarios. This is commonly used in financial services/ trading businesses to constantly assess the risk and impact of trading.

A detailed analysis of requirements would be required and a bit out of scope for this blog post.

Summary

For OLAP users looking to simplify the BI life cycle, the Actian Vector analytics database provides a viable alternative to OLAP Cubes with its ground-breaking technology, superior performance and in-database analytic capabilities. The benefit of migrating is reduced costs and a better BI user experience by through query freedom.

Don’t simply take my word for it.  Try it for yourself.  We’ve prepared a guide and evaluation copy of Vector, along with all the supporting materials you’ll need to test Vector in about an hour.  You can ask our active Vector community questions here.


Blog | Actian Life | | 2 min read

HCL Technologies and Sumeru Equity Partners to Acquire Actian

Combined Data Apps

We’re excited to announce that HCL Technologies (HCL), a leading global technology company, and Sumeru Equity Partners (SEP), a technology-focused private equity firm, have signed a definitive agreement to assume 100 percent ownership of Actian Corporation. For Actian, it means the company will benefit from HCL’s expertise in delivering next-generation solutions for the cloud, IoT, cybersecurity, and autonomics, as well as expand our global reach. SEP, with its growth-oriented technology investment portfolio and market understanding, will help Actian identify and develop essential strategic alliances. HCL will take an 80% controlling ownership and Sumeru will hold approximately 20%.

Actian will continue to operate as a separate entity, led by current CEO and President Rohit De Souza, but will do so within the HCL Technologies ecosystem, benefiting from HCL’s global capabilities. Together, we are committed to delivering innovative products and services to support you and your customers.

What Will This Mean for You, Actian’s Customers and Partners?
This strategic combination of industry leaders will help accelerate product innovation in the Hybrid Data arena, and expand our reach by bringing our existing innovative product portfolio to customers across the globe.

Key Dimensions of This Partnership:

  • Ownership committed to the long-term success and growth of Actian hybrid data solutions and other investments by Actian.
  • Investment in key areas of innovation including machine learning, edge computing, and hybrid cloud services.
  • An aggressive expansion of technology and channel partnerships as we seek to accelerate the development and growth of our hybrid data management, integration and analytics solutions business both on-premises and in the cloud.
  • Deep industry expertise to help deliver next-generation IT services across the globe, including more comprehensive solutions focused on targeted horizontal and industry use cases.

What Happens Next?
The deal is expected to close in the third quarter of this calendar year. We are absolutely committed and focused on continuing to deliver the most innovative hybrid data products and solutions in the industry. We will keep the communication channels open as we work through the transition over the next few months and finalize the details of this exciting new chapter for our company. We expect to be able to bring more value to you, our customers. Many thanks for your continued support.

Best regards,

Rohit De Souza
President & CEO
Actian Corporation


Last November, we announced that Actian Vector – Community Edition, our high-performing SQL analytics solution for the cloud, launched for free on the AWS Marketplace. Now we’re happy to announce that a similar version has now been released on the Microsoft Azure Marketplace in a similar free-to-use pricing model.

If you are a SQL analytics application or solution developer who is considering building a high-performing SQL analytics solution in the Cloud or struggling with the cost, performance, or maintenance overhead of your existing SQL analytics application in the Cloud, then consider Vector Community Edition as the SQL database that drives your application.

What Makes Vector Different?

Vector is different in a number of ways. It was built from the ground up to utilize modern hardware architecture in ways that no other product can. Vector includes several innovations that exploit available features in a modern CPU such as SIMD2 instructions, larger chip caches, super-scalar functions, out-of-order execution, and hardware-accelerated string-based operations to name a few.

These innovations make Actian Vector achieve record performance and price/performance levels for the Transaction Processing Performance Council’s Industry Standard TPC-H benchmark. Additionally, Vector’s innovations can significantly impact your application performance. The users or services that interact with your application can take action much more quickly since you can provide them insights much faster than before.

If doing fast SQL analytics is important to your application or service and you’re struggling to do it economically, Vector can help you.

Vector also requires minimal tuning. You load your large analytic datasets into it and run your queries to get back results almost instantaneously. This frees you from doing complex DBA tasks to focus on your application/service instead.

Actian Vector – Community Edition on Microsoft Azure

You can learn more about Vector, the Community Edition on Microsoft Azure, and getting it all set up with the following links: