From Spatial to Vectors: How HCL Informix® Brings AI to Your Existing Data


Summary
- Actian introduces native vector support in Informix, enabling AI use cases without new databases.
- Eliminates data movement by combining vectors and operational data in one system.
- Supports SQL-based similarity search with full ACID transactions.
- Reduces complexity by leveraging existing security, governance, and infrastructure.
- Positions “vector as a feature” over standalone vector databases.
The Database That Keeps Evolving
Here’s a story I don’t share often. Working on databases in college made me hate them.
Then karma did what karma does: one of my first jobs involved Informix. That was nearly 30 years ago, and the rest is history. What kept me around wasn’t just the performance or the reliability: it was the fact that Informix never stood still. Every time the industry said, “you need a new tool for that,” Informix said, “or you could just teach me.”
Today, the industry says you need a dedicated vector database for AI. Pinecone. Milvus. Weaviate. A whole new category of infrastructure to deploy, secure, and maintain. And what for? Just to store embeddings alongside the data you already manage.
I’m here to tell you: you don’t need another database. You need the one you have to do more. And that’s exactly what’s happening. HCL Informix®15 is getting native vector support, coming in Summer 2026. And it’s Actian making it happen.
Be the among the first to try the vector blade in HCL Informix 15. Join Waitlist
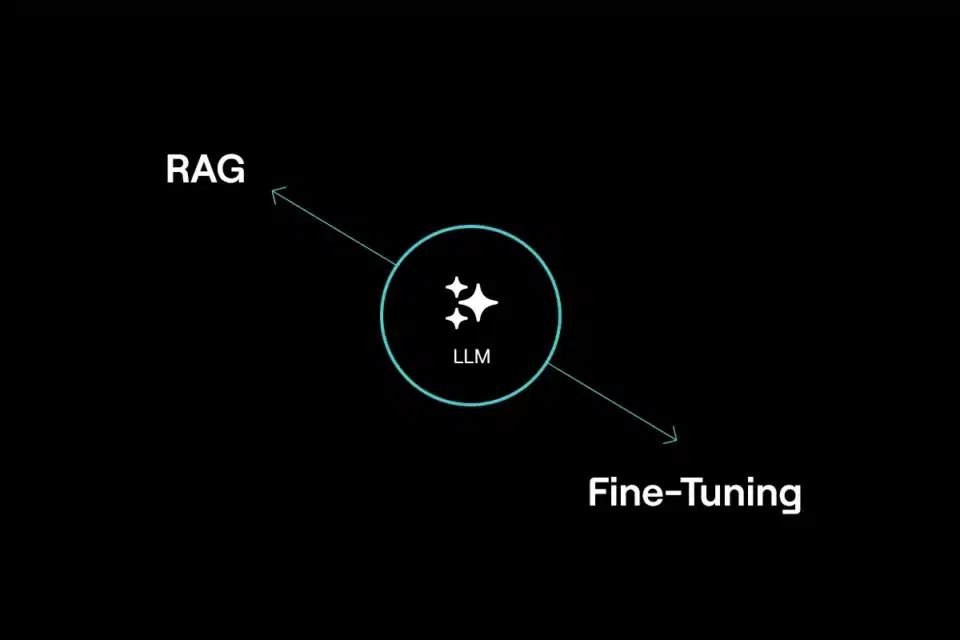
Why Vector Matters for Your Business
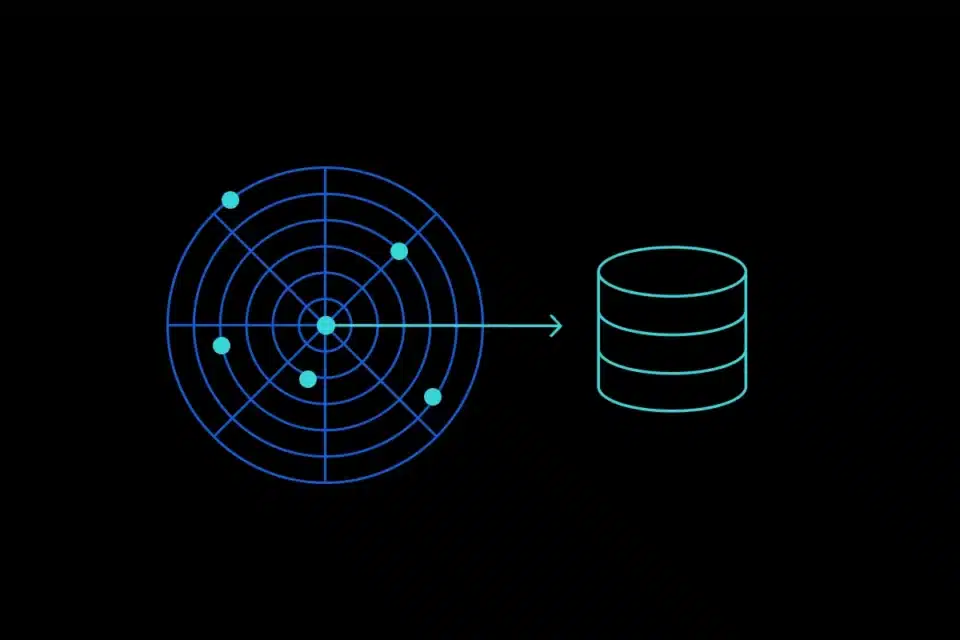
Before we get into the how, let’s talk about the why. Vector search turns unstructured data (text, images, sensor readings, documents) into numerical representations called embeddings. These embeddings can then be compared for similarity. That’s the foundation of semantic search, recommendation engines, and retrieval-augmented generation (RAG). This is the state of the art of AI now.
This isn’t abstract or futuristic. It’s happening right now across the industries where Informix has been a trusted workhorse for decades.
Retail: Product recommendations and visual search that understand intent, not just keywords.
Manufacturing: Anomaly detection from sensor embeddings, catching defects before they become recalls.
Financial services: Fraud pattern matching and document similarity across millions of transactions.
IoT: Similarity-based alerting on time series patterns, a natural bridge from Informix’s existing world-class TimeSeries capabilities.
Hospitality: A hotel chain stores guest profiles in Informix, including booking history, room preferences, dining choices, and spa usage. With vector embeddings, a similarity search at check-in finds guests with the most similar taste profiles and surfaces what they enjoyed: the rooftop restaurant, the late checkout, the spa package, or the bourbon selection at the bar (they start to know me really well). Not because a rule said so, but because similar guests loved it. And because HCL Informix supports read/write vectors, the guest’s embedding updates with every stay, every meal, every review, and this happens within the same ACID transaction that records the booking. No batch job. No stale recommendations.
The pressure from leadership is real: “add AI” without increasing operational overhead. But there’s a subtler challenge that kills most AI initiatives: the path to production. A proof of concept is easy. Getting it through security review, compliance certification, infrastructure provisioning, backup integration, and operational sign-off? That’s where projects stall (or die more or less quietly). Vector support inside your existing database collapses that path. The security model is already approved. The backup procedures are already in place. The ops team already knows the engine. You’re not asking anyone to adopt new infrastructure. You’re asking them to do more with what they trust.
Nothing Like Informix Doing Vector
Yes, there are vector databases. Yes, PostgreSQL has pgvector. But none of them are Informix.
The new HCL Informix vector blade introduces a native vector data type through the same extensibility architecture that made Informix a leader in spatial, time series, and JSON data. Vectors aren’t bolted on or constrained — they’re first-class citizens, replicated, backed up, indexed, and governed like every other data type in the engine.
Other databases are adding vector support too, but the depth of implementation varies. PostgreSQL with pgvector is the most popular open-source option, but scaling it for enterprise workloads requires careful tuning, and you’re on your own for security and governance. Oracle AI Vector Search is technically strong, but brings Oracle’s heavyweight stack, licensing costs, and complexity with it. And standalone vector databases like Pinecone or Milvus? They solve one problem while creating another: a new system to deploy, secure, sync, and pay for.
HCL Informix takes a different approach. The vector blade treats vectors as native types inside the engine, with the same operational maturity you expect from every other data type Informix handles. Embeddings can be inserted, updated, and deleted like any other column. This enables dynamic RAG workflows, real-time updates, and operational AI (clearly, not just batch analytics).
Here’s what makes HCL Informix unique in this space:
True multi-model from the ground up. SQL + NoSQL + JSON + time series + spatial + vector, all in one engine. Not bolted on, architecturally native.
Proven at scale. 2 million+ transactions per second, enterprise-grade high availability, minimal administration overhead. Your vectors get the same industrial treatment as your transactional data.
No data duplication and no data movement. Your operational data and your AI-ready embeddings live side by side, governed by the same security, backed up by the same processes. No ETL to a sidecar vector store.
SQL you already know. Similarity search through standard SQL using vector distance metrics. No new query language, no new API. If your team knows SQL (and they do, I saw it), adoption will be fast.
ACID on vectors. Transactions that include vector operations alongside relational updates with full consistency. Try that with Pinecone.
AI framework integration. Developers can use HCL Informix as a vector store for RAG applications, connecting directly to AI frameworks.
Free for HCL Informix customers. No additional licensing. No surprise costs. If you run HCL Informix, you get vector capabilities.
And it was no surprise that when I interviewed my friend, Pradeep “M” Muthalpuredathe, Actian’s VP of Engineering for Database Solutions, he frankly told me:
Business leaders in enterprises are consistently being told they need a new database for their AI solutions. I disagree. What they need is for the database they already trust to continuously innovate and meet their requirements. That’s what Informix has always done. Spatial? We got it. Time series? Got it. JSON? Same. Now vectors. HNSW indexing. Semantic search. Production-grade RAG. You see where this is going. All inside the engine our customers love and have relied on for decades. HCL Informix doesn’t ask you to start over. It grows with you and your business needs. That’s not marketing: that’s 30+ years of engineering conviction.
Informix in the Actian AI Ecosystem
The HCL vector blade doesn’t exist in isolation. Actian is building an AI-ready ecosystem around HCL Informix:
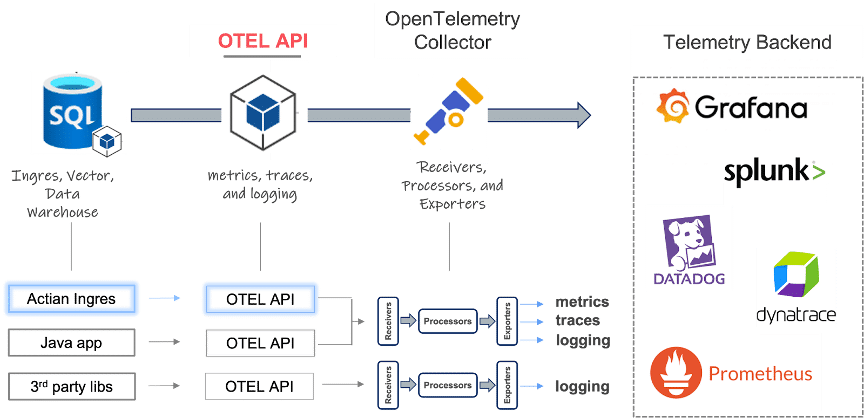
The new MCP Server for HCL Informix, also an Actian exclusive, not available for IBM Informix, exposes database capabilities, including vector search, as tools that AI agents can call directly. Your Informix data becomes accessible to agentic AI workflows without custom integration.
Combined with the Actian Data Intelligence Platform for governance and discovery, Actian Data Observability for data quality monitoring, and Actian AI Analyst (fka Wobby) for conversational analytics grounded in a governed semantic layer, vector data in Informix feeds an ecosystem where business users can ask questions in natural language and get trusted answers from the data you already manage. This isn’t a silo play. This is about making your entire data stack AI-aware from storage to insight.
And let me be direct: both the vector blade and the MCP Server are HCL Informix innovations, researched and developed by Actian. They will not be available in IBM Informix. This is what active R&D investment looks like.
Your Database, Now AI-Ready
You don’t need another database. You need the one you have to do more.
Informix has always been at the forefront of innovation. From being one of the first multi-model databases to handling spatial, time series, and JSON data natively, the engine has never stopped learning. The vector blade is the next chapter, and it’s being written solely by Actian.
My personal wish for what comes next? Native support for data contracts and data products. Through the Linux Foundation’s Bitol project, I chair the development of open standards like ODCS and ODPS. Imagine Informix not just storing your data and vectors, but natively understanding the contracts that describe it and the products that deliver it. No other database does that.
They say you can’t teach an old dog new tricks. They’re wrong. They just haven’t met Informix.
The vector blade for HCL Informix ships in Summer 2026. It’s free for HCL Informix 15 customers.
Sign up for the waitlist to be among the first to bring AI into your Informix environment.
Informix is a trademark of IBM Corporation in at least one jurisdiction and is used under license.
Three Decades of Teaching Informix New Tricks
The DataBlade® Legacy
The DataBlade® architecture, born in the mid-1990s with Informix Universal Server, was built on a radical idea: the database engine should be able to learn new data types without being rebuilt. Instead of waiting for the vendor to add support for your data, you could extend the engine itself.
That architecture proved itself again and again. Informix was the first commercial database ported to Linux. Spatial data? DataBlade. Time series? DataBlade. JSON and BSON? Native support is built on the same extensibility framework. Each time a new data paradigm emerged, Informix absorbed it natively rather than requiring a separate engine or a bolt-on service.
In fact, this isn’t even Informix’s first encounter with vectors. The Excalibur Image DataBlade, available in the late 1990s, extracted feature vectors from images using neural network techniques and performed similarity search on them, returning ranked results based on vector distance. That was vector similarity search inside a relational database, before “vector database” was even a term.
The vector blade isn’t a new idea for Informix. It’s a homecoming.
Actian Invests, Informix Evolves
The vector blade is an HCL Informix innovation, developed by Actian. It will not be available in IBM Informix.
Actian is actively investing in Informix R&D. HCL Informix 15 delivered massive scalability improvements, external smartblobs, Kubernetes deployment, and REST APIs. The return of 4GL availability. And now, native vector support.
This is not a product on life support. This is a database with an active engineering roadmap, a dedicated R&D team, and a company that’s building its future, not just maintaining its past.
Comparison Table: Vector Database Landscape
| HCL Informix | DB2 | pgvector | Oracle AI | Pinecone Milvus | LanceDB | |
| Read/Write vectors | Yes | Yes* | Yes | Yes | Yes | Yes |
| Vector replication | Yes | No | Yes | Yes | N/A | N/A |
| Vector backup/restore | Yes | No** | Yes | Yes | N/A | N/A |
| Vector indexing | Yes | Early preview | Yes (HNSW) | Yes | Yes | Yes |
| SQL-native | Yes | Yes | Yes | Yes | No | No |
| Multi-model (same engine) | Yes | Limited | Extension | Yes | No | No |
| ACID on vectors | Yes | Yes | Yes | Yes | No | No |
| On-prem/hybrid | Yes | Yes | Yes | Yes | Limited | Yes |
| Operational footprint | Light | Heavy | Varies | Heavy | New infra | Light |
| Free for existing customers | Yes | No | Open source | No | No | Open source |
| Enterprise security | Yes | Yes | DIY | Yes | Limited | DIY |
* DB2 12.1.2+ supports INSERT/UPDATE on VECTOR columns, but with significant operational constraints [16].
** DB2 documentation states: “Logical backup and restore operations do not support the VECTOR type” [16].
DB2: [9], [10], [16], [17]. pgvector: [15], [18]–[21]. Oracle: [22]–[27]. Pinecone/Milvus: [21], [28]–[30]. LanceDB: [14]. Excalibur heritage: [31], [32]. Comparison based on publicly available information as of March 2026.
Bibliography
HCL Informix, Product & Capabilities
- Actian. “HCL Informix: High-Performance Database.” https://www.actian.com/databases/hcl-informix/
- Taylor, Emily. “Experience Near-Unlimited Storage Capacity With HCL Informix 15.” Actian Blog, August 2025. https://www.actian.com/blog/databases/hcl-informix-15/
- Schulte, Mary. “User-Friendly External Smartblobs Using a Shadow Directory.” Actian Blog, February 2025. https://www.actian.com/blog/databases/user-friendly-external-smartblobs-using-a-shadow-directory/
- “Data Wars: The Rise of HCL Informix.” Actian Blog, February 2025. Dedicated to Carlton Doe III (in memoriam), founding member of IIUG. https://www.actian.com/blog/databases/data-wars-rise-of-hcl-informix/
- Johnson, Nick. “Imagine New Possibilities With HCL Informix.” Actian Blog, August 2025. https://www.actian.com/blog/databases/imagine-new-possibilities-with-hcl-informix/
Actian AI Ecosystem
- Radh, Dee. “Actian’s Winter 2026 Product Launch Solves the Agentic Trust Problem and More.” Actian Blog, February 2026. https://www.actian.com/blog/product-launches/winter-2026-launch/
- Actian Corporation. “Actian Introduces Data Observability Agents for the Agentic AI Era.” Press release, February 24, 2026. ViaBigDATAwire.
- Actian. “Actian Data Intelligence Platform.” https://www.actian.com/data-intelligence/platform/
Competitive Landscape & Comparison Table Sources
- IBM. “Announcing IBM Db2 12.1.2: Empowering your AI and cloud data transformation.” June 2025. https://www.ibm.com/new/announcements/ibm-db2-12-1-2-empowering-your-ai-and-cloud-data-transformation
- IBM. “IBM Db2 12.1.3 now generally available.” November 2025. https://www.ibm.com/new/announcements/ibm-db2-12-1-3-now-generally-available-advancing-ai-for-enterprise-data-management
- IBM. “Announcing the IBM Db2 Vector Store integration forLlamaIndex.” November 2025. https://www.ibm.com/new/announcements/announcing-the-ibm-db2-vector-store-integration-for-llamaindex
- LangChain. “IBM db2 vector store and vector search integration.” https://python.langchain.com/docs/integrations/vectorstores/db2/
- SQLServerCentral. “Vectors in SQL Server 2025.” March 2026. https://www.sqlservercentral.com/articles/vectors-in-sql-server-2025
- LanceDB. https://lancedb.com/
- pgvector. PostgreSQL vector extension. GitHub. https://github.com/pgvector/pgvector
- IBM. “Vector values.” Db2 12.1.x docs. Sections: “UPDATE and INSERT operations with vectors” (confirms read/write), “Vector limitations” (no replication, no logical backup/restore, no index/primary/foreign keys, no ORDER BY, no GROUP BY, no JOIN, no SELECT DISTINCT). https://www.ibm.com/docs/en/db2/12.1.x?topic=list-vector-values
- Garcia-Arellano, Christian. “Vector Indexes in Db2 — An early preview.” IDUG, February 12, 2026.
- Instaclustr/NetApp. “pgvector: Key features [2026 guide].” “Replication, backup, and role-based access control automatically extend to vector data.” https://www.instaclustr.com/education/vector-database/pgvector-key-features-tutorial-and-pros-and-cons-2026-guide/
- Calmops. “PostgreSQL Vector Search: Complete Guide 2026.” “pg_dumpand continuous archiving work with vector columns. Point-in-time recovery includes vector data.” https://calmops.com/database/postgresql-vector-search-pgvector-2026/
- Microsoft Azure. “Optimize performance of vector data on Azure Database for PostgreSQL.” HNSW andIVFFlatindexes, 2000-dimension limit. https://learn.microsoft.com/en-us/azure/postgresql/extensions/how-to-optimize-performance-pgvector
- DEV Community (polliog). “PostgreSQL as a Vector Database.” 2026. ACID transactions for vectors + relational data; “No ACID — Like Pinecone, not a general database.” https://dev.to/polliog/postgresql-as-a-vector-database-when-to-use-pgvector-vs-pinecone-vs-weaviate-4kfi
- Oracle. “Oracle AI Vector Search User’s Guide.” VECTOR data type, INSERT/UPDATE, similarity search. https://docs.oracle.com/en/database/oracle/oracle-database/26/vecse/overview-ai-vector-search.html
- Oracle blog. “GoldenGate23ai and Oracle Database 23ai Vectors.” “Full replication of vectors.” https://blogs.oracle.com/dataintegration/goldengate-database-23ai-vectors
- Oracle blog. “GoldenGate23ai vector replication between Oracle and PostgreSQL.” https://blogs.oracle.com/dataintegration/goldengate-23ai-vector-replication
- Oracle. “Oracle Database 23ai Brings the Power of AI.” May 2024. “All mission-critical features now work transparently with AI vectors.” https://www.oracle.com/news/announcement/oracle-announces-availability-database-23ai-with-ai-vector-search-2024-05-02/
- Oracle. “Oracle AI Database 26ai Release Notes.” “Data redaction is not supported for the VECTOR data type.” https://docs.oracle.com/en/database/oracle/oracle-database/26/rnrdm/issues-all-platforms-2.html
- Oracle. “Indexing Guidelines with AI Vector Search” (June 2025) and “Using Hybrid Vector Indexes” (May 2025). https://www.oracle.com/database/ai-vector-search/
- Oracle (competitive page). “What Is Pinecone?” “Lacking in SQL support and advanced relational querying.” https://www.oracle.com/database/vector-database/pinecone/
- Pinecone Docs. “Database limits.” https://docs.pinecone.io/reference/api/database-limits
- BraincuberTechnologies. “Pinecone vs pgvector: Comparison Guide 2025.” https://www.braincuber.com/blog/pinecone-vs-pgvector-which-vector-db-for-your-project
- Oninit. “Excalibur Text Search DataBlade Module.” etx access method, ranked text search. https://www.oninit.com/manual/informix/english/docs/dbdk/is40/dbdktour/xb4.html
- IBM. “Excalibur Image DataBlade Module.” Feature vector extraction via neural networks, similarity search with ranked results. https://public.dhe.ibm.com/software/data/informix/pubs/pdfs/excalibur2.pdf
Informix History & Community
- “Informix.” Wikipedia. https://en.wikipedia.org/wiki/Informix
- “Actian.” Wikipedia. https://en.wikipedia.org/wiki/Actian
- International Informix Users Group (IIUG). https://www.iiug.org
- IBM. “IBM Informix DataBlade Modules: Release notes.” https://www.ibm.com/support/pages/ibm-informix-DataBlade-modules-release-notes-documentation-notes-and-machine-notes
- “Informix Corporation.” Wikipedia. https://en.wikipedia.org/wiki/Informix_Corporation
Industry Trends
- McKinsey & Company. 51% of enterprises using AI have encountered negative consequences. Referenced in Actian Data Observability Agents press release [7].
- Gartner. “By 2026, 50% of enterprises implementing distributed data architectures will have adopted data observability tools.” Market Guide for Data Observability Tools, June 2024.
- Actian Corporation. “The Governance Gap: Why 60% of AI Initiatives Fail.”ActianBlog. https://www.actian.com/blog/data-governance/the-governance-gap-why-60-percent-of-ai-initiatives-fail/
Actian AI Analyst
- Actian Corporation. “Actian Unveils Conversational Analytics Solution.” Press release, March 10, 2026. https://www.actian.com/company/press-releases/actian-unveils-conversational-analytics-solution-with-intelligently-generated-semantic-foundation-for-trusted-insights/

Stay connected
Data insights delivered to you.
(i.e. sales@..., support@...)
 The ingestion cliff
 Integrated query execution vs. application layer merge
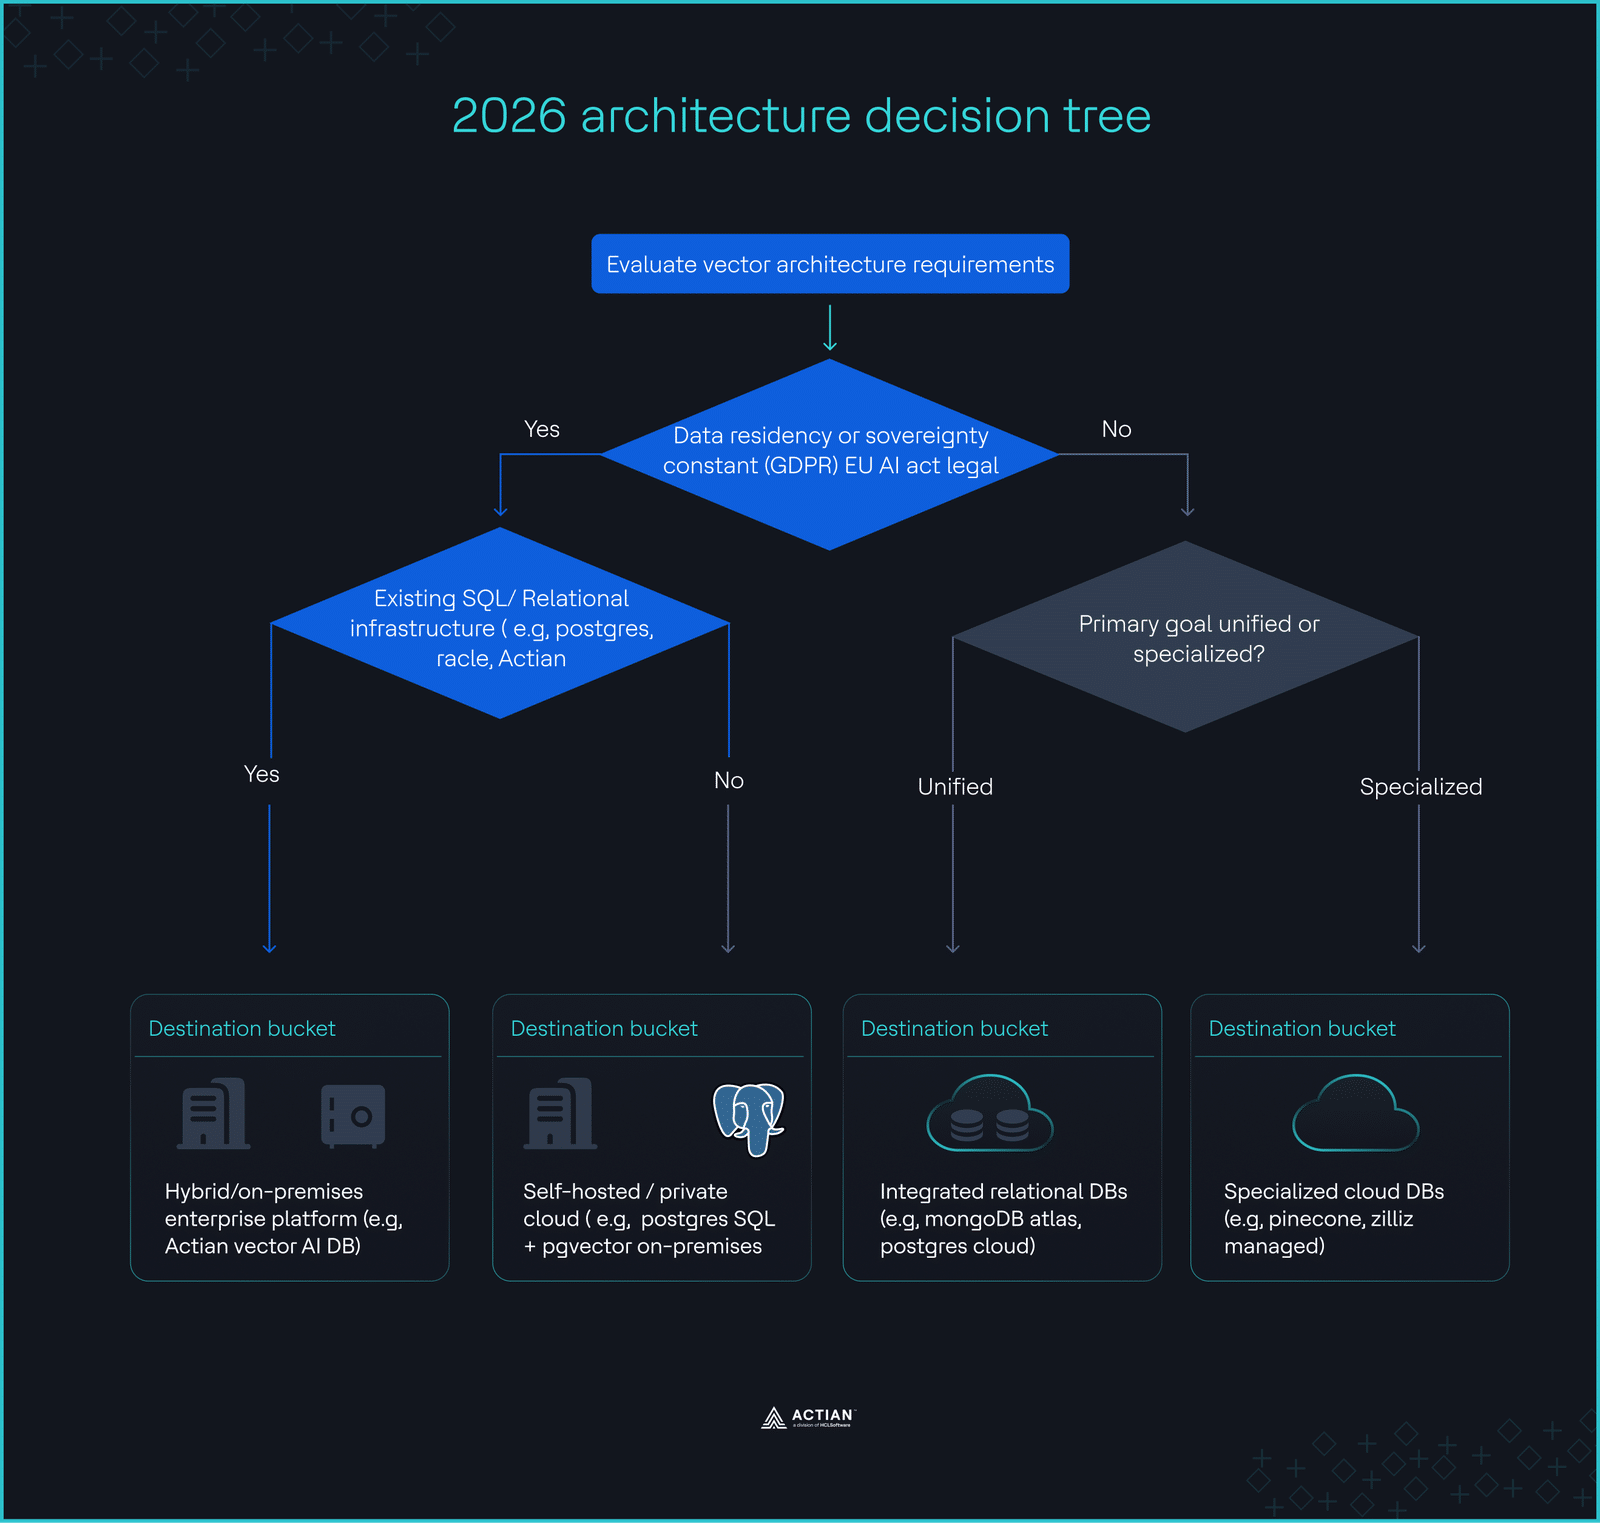 The 2026 architecture decision tree