
Build a Vector Database Monitoring Stack with Prometheus and Grafana


Key Takeaways
- VectorAI DB exposes native Prometheus metrics for monitoring latency, memory, errors, and index health.
- The tutorial builds a Docker Compose monitoring stack with VectorAI DB, Prometheus, and Grafana.
- A four-panel dashboard tracks request rate, p95 latency, gRPC errors, and memory pressure.
- Eight alert rules help teams detect recovery mode, rebuild failures, high latency, and resource pressure.
- The setup helps teams identify performance problems before they impact production vector search and RAG workloads.
VectorAI DB exposes a native /metrics endpoint in Prometheus/OpenMetrics format on port 6573. This tutorial wires that endpoint into a Docker Compose stack with Prometheus and Grafana, builds a four-panel dashboard you can import directly, and configures eight alert rules from VectorAI DB’s monitoring documentation. Before the setup, here’s what those metrics really track.
What Vector Database Monitoring Measures
Vector database monitoring means keeping an eye on key signals to make sure your database is working as expected. These signals include query latency, memory usage, CPU usage, index health, and recall quality. Each one maps to a specific metric on your VectorAI DB instance.
Query latency is the time it takes for your k-nearest neighbors search to return results. Since vector search relies on similarity rather than exact matches, it’s the first number your SLA cares about. VectorAI DB tracks it through actian_vectorai_rest_responses_duration_seconds (p95/p99 per endpoint). Under memory pressure or during an index rebuild, latency can spike well beyond the normal baseline, sometimes from roughly 20ms to 500ms.
The actian_vectorai_memory_resident_bytes metric shows how much RAM your vector indexes use. Another key metric is actian_vectorai_process_major_page_faults_total. A steady rise here indicates memory pressure and may signal that the OS is fetching pages from disk-backed storage, which typically degrades query latency.
actian_vectorai_process_threads reports thread count during similarity calculations. A rising thread count under load reflects processor demand, and pairing it with system-level CPU metrics from the Prometheus node exporter gives you the full picture.
Index health gives you insight into what’s happening in the background. The actian_vectorai_collection_running_optimizations and actian_vectorai_rebuild_running metrics show when rebuilds are happening. actian_vectorai_rebuild_failed_total tracks any failures, and actian_vectorai_rebuild_duration_seconds shows how long rebuilds take.
VectorAI DB doesn’t expose recall, the percentage of true nearest neighbors returned, as a live metric. Validate it offline with a labeled test set and use latency and error rate instead.
What You’ll Build
Getting VectorAI DB into production means being able to show what the system looks like under load, how to spot a degraded state, and how you’d get alerted before an incident. Monitoring is especially important for retrieval-augmented generation (RAG) workloads using large language models because latency spikes or index failures can degrade AI response quality. The right monitoring setup tells you when latency is increasing, when memory pressure is building, and when index rebuilds are failing, before any of it reaches users.
VectorAI DB provides a /metrics endpoint on port 6573 in Prometheus/OpenMetrics format, so you don’t need extra exporters or agents for application metrics. The optional Prometheus node exporter covers host-level CPU and memory if you need system-wide visibility beyond what VectorAI DB exposes directly.
In this tutorial, you’ll connect that endpoint to a Docker Compose stack with VectorAI DB, Prometheus, and Grafana. You’ll build a four-panel dashboard you can import right away and set up eight alert rules based on VectorAI DB’s monitoring docs.
By the end, you’ll have a dashboard and configured alert rules running against your own instance.
What the Metrics Endpoint Exposes for Vector Database Performance
VectorAI DB provides its metrics at GET /metrics on the REST API port (default 6573) in Prometheus/OpenMetrics format. There’s no authentication on this endpoint, so if you expose it on a public network, protect it with a firewall or reverse proxy and access controls.
All metrics start with the actian_vectorai_ prefix. The table below lists the main metrics in six categories, showing their type and what they reveal about system health and resource use.
| Metric (without prefix) | Type | What it tells you |
| app_info | Gauge | Application identity and version |
| app_status_recovery_mode | Gauge | 1 if the engine is in recovery mode, 0 otherwise |
| collections_total | Gauge | Total number of collections, in memory and on disk |
| collection_point_total | Gauge | Aggregate point count across all collections |
| collection_vectors | Gauge | Vector count per named vector space |
| collection_running_optimizations | Gauge | 1 if a collection is mid-rebuild, 0 if idle |
| rebuild_running | Gauge | 1 if a rebuild is in progress for a collection |
| rebuild_failed_total | Counter | Cumulative count of failed or canceled rebuilds |
| rebuild_duration_seconds | Histogram | Time to complete an index rebuild |
| rest_responses_total | Counter | REST responses by endpoint, method, and status |
| rest_responses_fail_total | Counter | REST responses that returned a 5xx status |
| rest_responses_duration_seconds | Histogram | REST request latency per endpoint and method |
| grpc_responses_total | Counter | gRPC responses by method and status |
| grpc_responses_fail_total | Counter | gRPC responses with an error status |
| grpc_responses_duration_seconds | Histogram | gRPC call latency per method |
| memory_resident_bytes | Gauge | RAM consumed by the process (RSS) |
| process_threads | Gauge | Live thread count |
| process_open_fds | Gauge | Open file descriptor count |
| process_major_page_faults_total | Counter | Major page faults since process start |
| process_disk_usage_bytes | Gauge | Disk space consumed by the process data path |
Set Up the Stack
Prerequisites
Before you start, install the following:
-
- Docker and Docker Compose
- Python 3.10 or higher
- VectorAI DB (sign up for the community edition)
- actian-vectorai-client Python SDK:
pip install actian-vectorai-client
Make sure your machine has at least 8 GB of RAM (16 GB is recommended) and 10 GB of disk space.
If you’re using Windows, run all commands in WSL2. To set up WSL2, run wsl --install in PowerShell, then use the Ubuntu terminal for this tutorial.
Project structure
Create a project directory and folder structure:
mkdir -p vectorai-observability/{prometheus,grafana,scripts}
cd vectorai-observability

touch docker-compose.yml prometheus/prometheus.yml prometheus/alert_rules.yml scripts/load_test.py
Your project directory should look like this:
vectorai-observability/

├── docker-compose.yml

├── prometheus/

│   ├── prometheus.yml

│   └── alert_rules.yml

├── grafana/

└── scripts/

    └── load_test.py
Your observability stack will run as three Docker Compose services: VectorAI DB (REST/metrics on 6573, gRPC on 6574, and the local UI on 6575), Prometheus (port 9090), and Grafana (port 3000).
services:
  vectorai:
    image: actian/vectorai:latest
    platform: linux/amd64
    container_name: vectorai
    ports:
      - "6573:6573"
      - "6574:6574"
      - "6575:6575"
    volumes:
      - ./local_data:/var/lib/actian-vectorai
    environment:
      - ACTIAN_VECTORAI_ACCEPT_EULA=YES
    restart: unless-stopped

  prometheus:
    image: prom/prometheus:latest
    container_name: prometheus
    ports:
      - "9090:9090"
    volumes:
      - ./prometheus/prometheus.yml:/etc/prometheus/prometheus.yml
      - ./prometheus/alert_rules.yml:/etc/prometheus/alert_rules.yml
    command:
      - "--config.file=/etc/prometheus/prometheus.yml"
    restart: unless-stopped
    depends_on:
      - vectorai

  grafana:
    image: grafana/grafana:latest
    container_name: grafana
    ports:
      - "3000:3000"
    volumes:
      - grafana_data:/var/lib/grafana
    environment:
      - GF_SECURITY_ADMIN_PASSWORD=admin
    restart: unless-stopped
    depends_on:
      - prometheus

volumes:
  grafana_data:
Add this to prometheus/prometheus.yml. For Docker Compose deployments, Prometheus resolves VectorAI DB by service name. If you’re running VectorAI DB as a standalone container outside the Compose network, use host.docker.internal:6573 as the scrape target instead:
global:
  scrape_interval: 15s

rule_files:
  - "alert_rules.yml"

scrape_configs:
  - job_name: "vectorai"
    scrape_interval: 15s
    static_configs:
      - targets: ["vectorai:6573"]

docker compose up -d
Go to localhost:9090/targets. The vectorai job should show 1/1 UP with a scrape duration under 20ms. If it shows DOWN, check that port 6573 is open and that no firewall is blocking the connection.

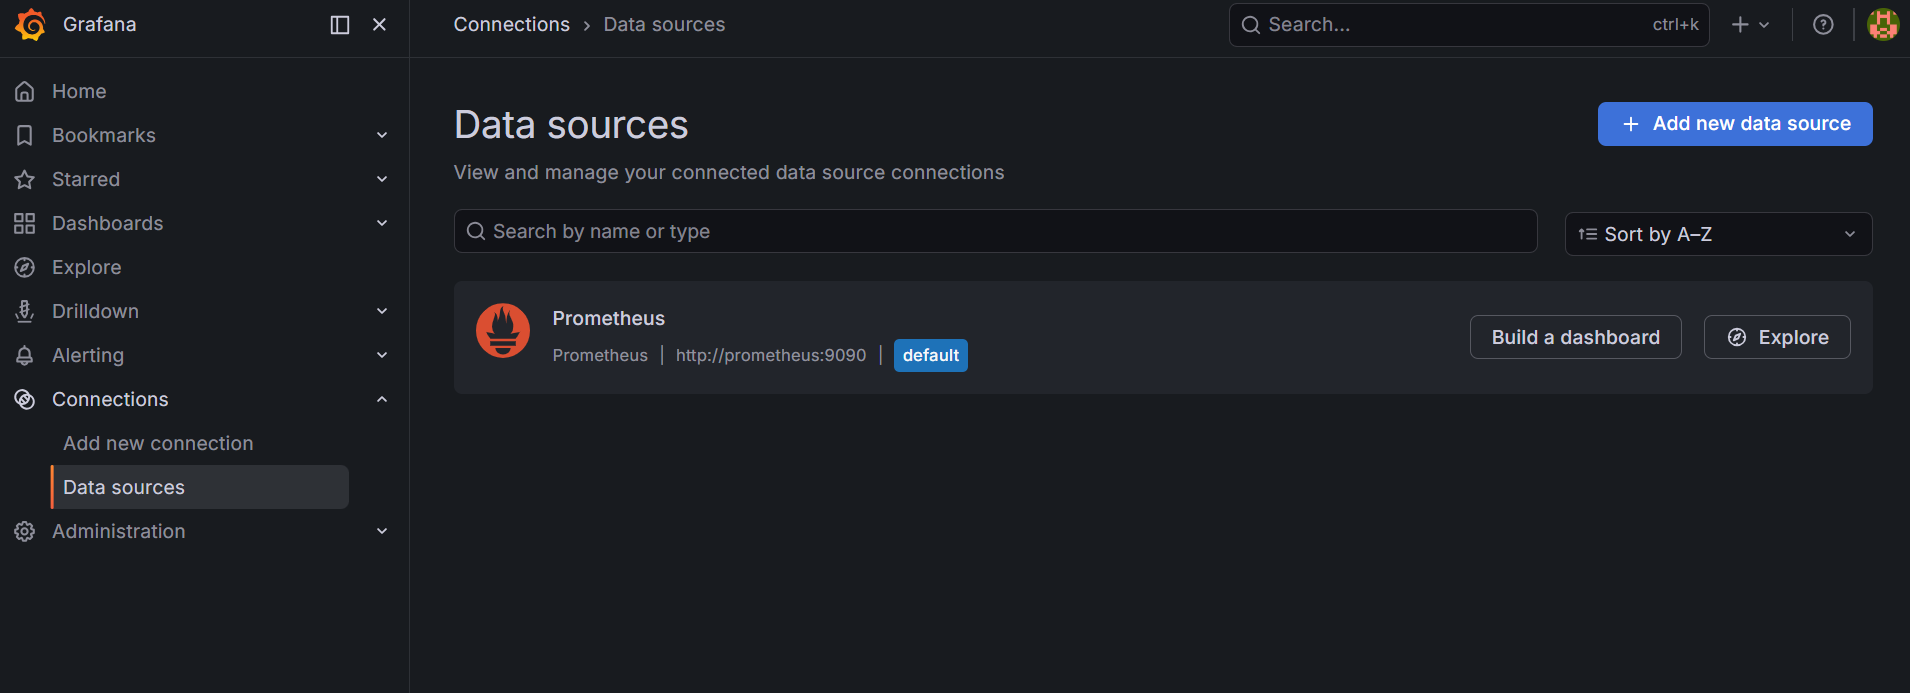
Go to localhost:3000 and log in with your admin credentials. Then go to Connections, choose Data sources, click Add new data source, select Prometheus, set the URL to http://prometheus:9090, make it the default, and save.
Build the Vector Database Dashboard
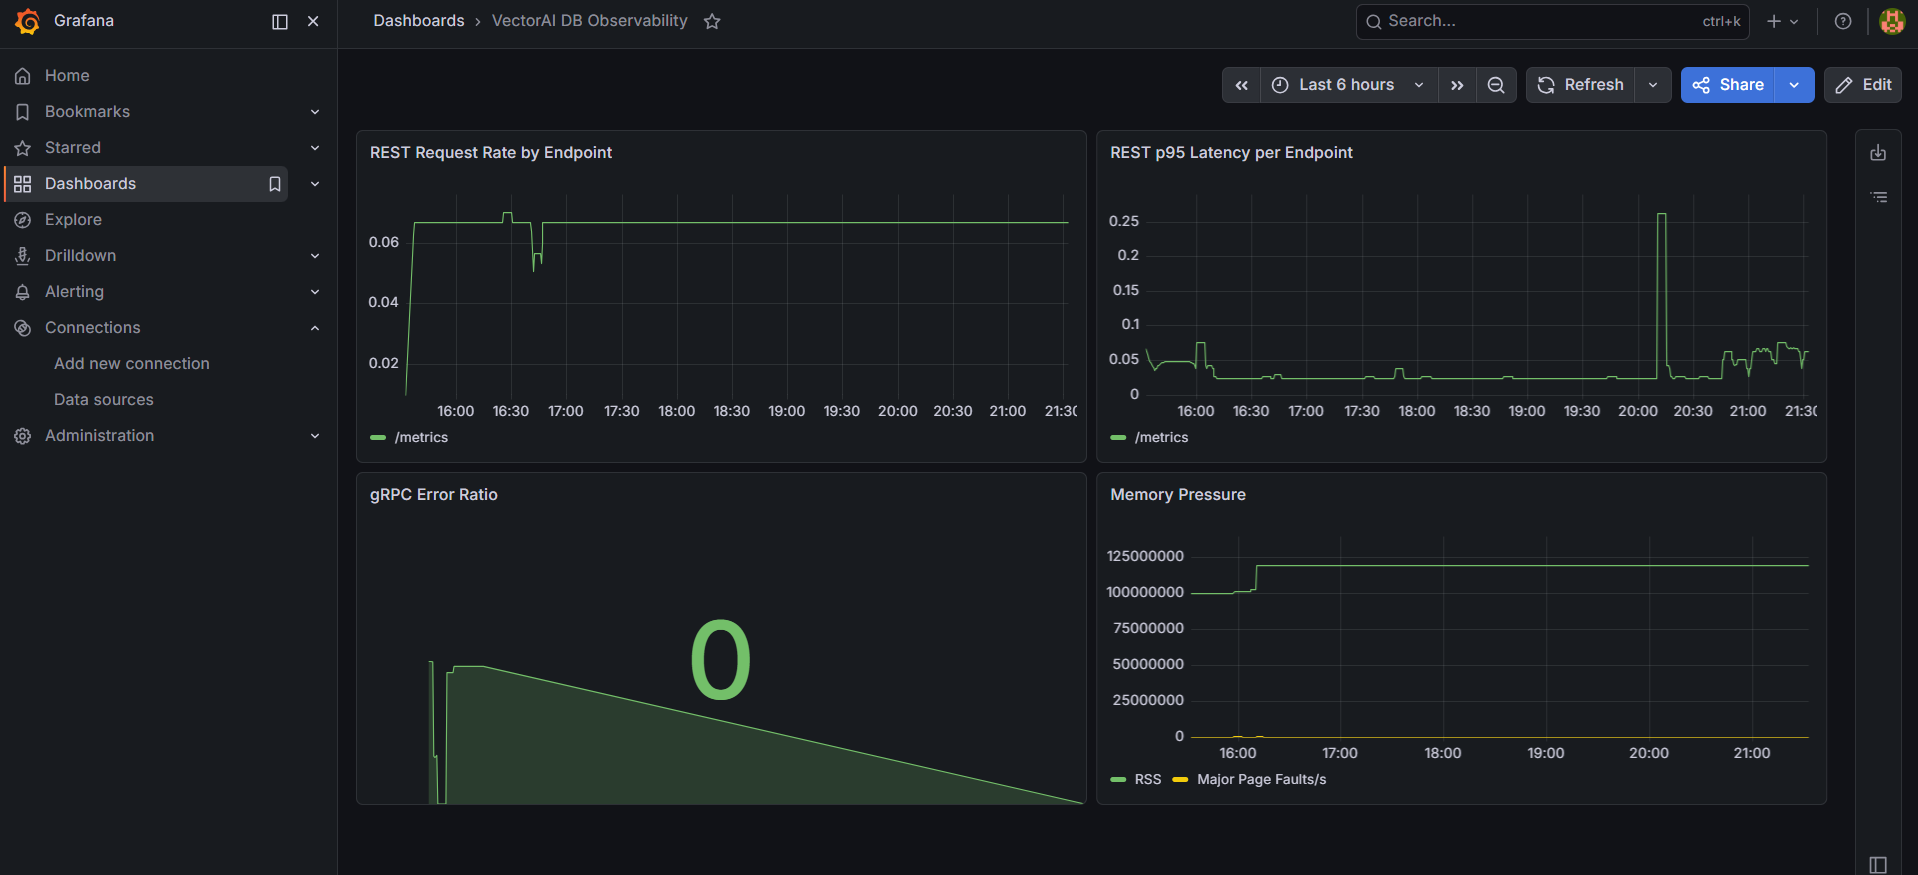
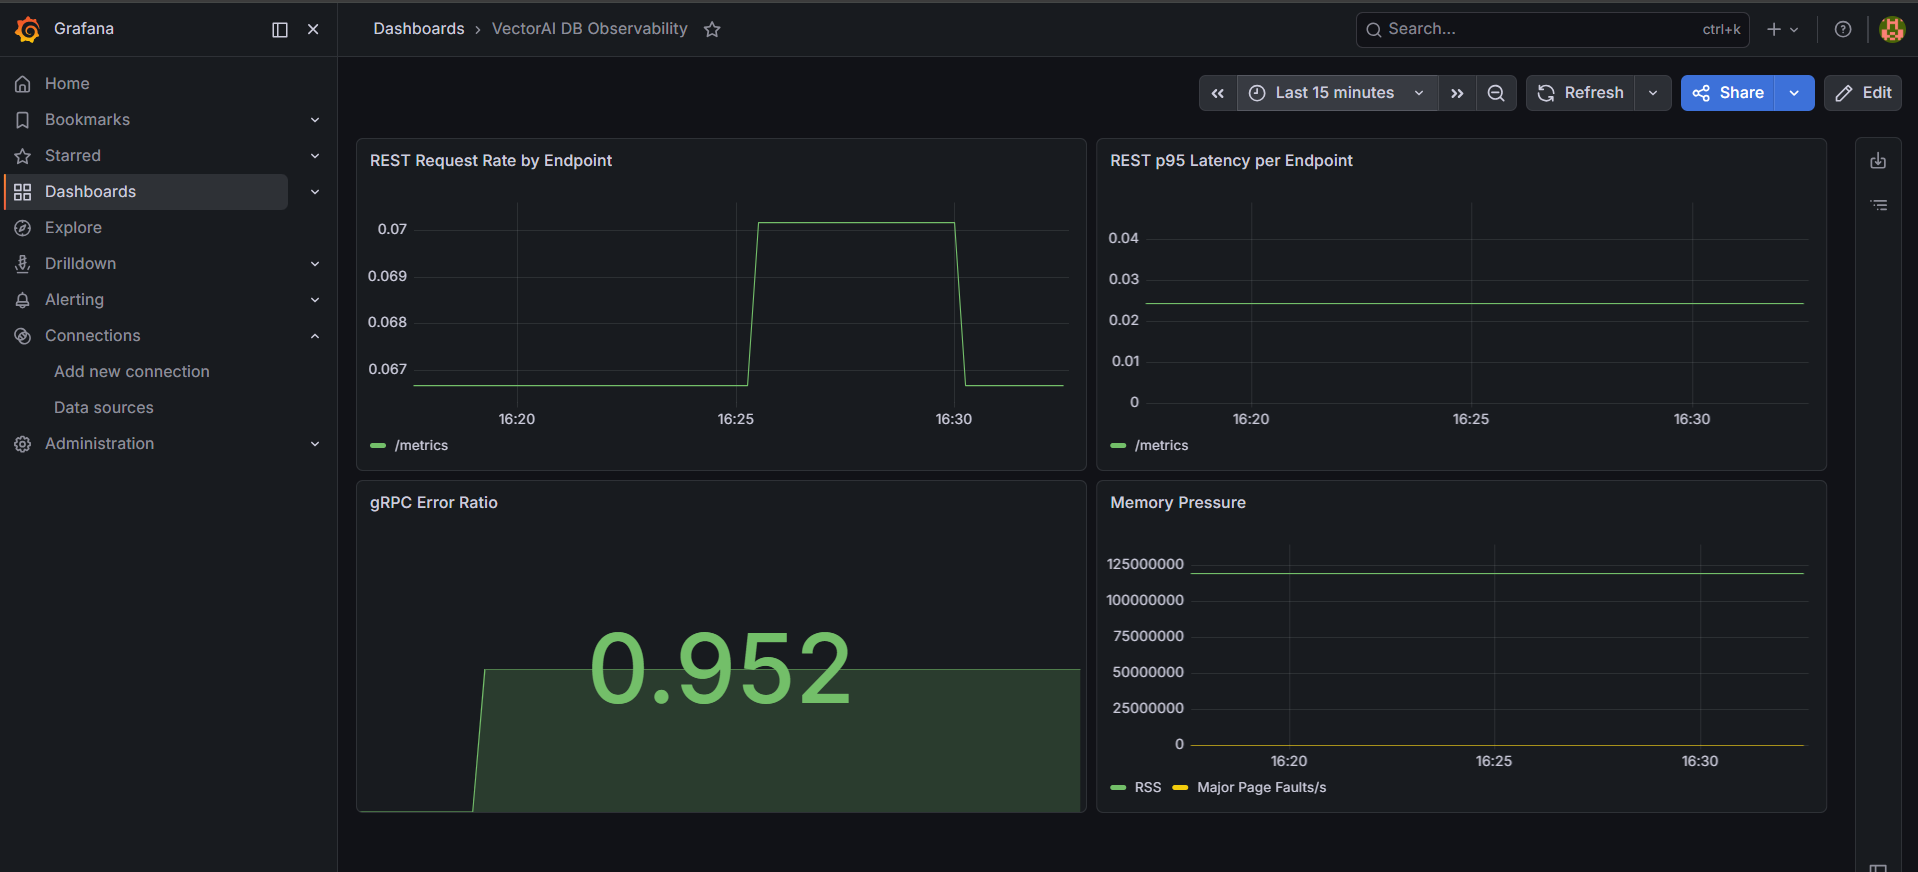
The dashboard tracks four key signals: request rate, p95 latency, error ratio, and memory pressure. Watching these helps you optimize indexing and search performance. Add the following PromQL queries to grafana/dashboard.json as you build each panel in Grafana.
Panel 1: REST request rate by endpoint
This panel shows query throughput per endpoint over time. Create a time series panel with this PromQL query:
sum by (endpoint) (rate(actian_vectorai_rest_responses_total[5m]))Set the legend format to {{endpoint}}. It shows throughput for each endpoint, so you can see which routes are driving load and spot query patterns before they impact performance.
Panel 2: REST p95 latency per endpoint
This is the primary latency signal for SLA monitoring. Prometheus histogram metrics actian_vectorai_rest_responses_duration_seconds automatically expose _bucket series, which is what histogram_quantile queries against. Create a time series panel:
histogram_quantile(0.95, sum by (le, endpoint) (rate(actian_vectorai_rest_responses_duration_seconds_bucket[5m])))Set the legend format to {{endpoint}}. If latency increases while the request rate stays steady, it could indicate memory pressure or an index rebuild affecting search performance.
Panel 3: gRPC error ratio
The Python SDK communicates over gRPC, so error monitoring happens at the gRPC layer. Create a stats panel with:
sum(rate(actian_vectorai_grpc_responses_fail_total[5m]))
/
(sum(rate(actian_vectorai_grpc_responses_total[5m])) > 0 or vector(1))
The query returns a fraction between 0 and 1. Set threshold values at 0.01 for green, 0.05 for yellow, and anything above 0.05 for red, or set the Grafana unit to percent (0-1) to display the values as percentages automatically. The panel moves from green to yellow as errors approach 5%, and to red once they cross it, catching a bad collection query or a connectivity failure before it compounds.
Panel 4: Memory pressure
This panel tracks two signals that together indicate whether the engine is operating within safe memory utilization bounds. Create a time series panel with two queries:
# RSS: RAM consumed by vector indexes
actian_vectorai_memory_resident_bytes

# Early warning signal for disk paging
rate(actian_vectorai_process_major_page_faults_total[5m])
Set the legend labels to RSS and Major Page Faults/s. If the fault rate increases while RSS is close to its limit, the engine will page to disk, and latency will soon increase.
After you’ve set up all four panels, open Dashboard settings, go to JSON Model, and copy the contents. Save this to grafana/dashboard.json. This file is also in the GitHub repo, so you can clone the repo and import it into Grafana right away.
Configure Alert Rules
Add the following alert rules to prometheus/alert_rules.yml. Prometheus loads them automatically on startup via the rule_files directive in prometheus.yml.
groups:
  - name: vectorai
    rules:
      - alert: VectorAIHighRESTErrorRate
        expr: >
          sum(rate(actian_vectorai_rest_responses_fail_total[5m]))
          /
          sum(rate(actian_vectorai_rest_responses_total[5m]))
          > 0.05
        for: 5m
        labels:
          severity: warning
        annotations:
          summary: "VectorAI DB REST error rate above 5%"
          description: "{{ $value | humanizePercentage }} of REST requests are returning errors."

      - alert: VectorAIHighRESTLatency
        expr: >
          histogram_quantile(0.95, sum by (le) (rate(actian_vectorai_rest_responses_duration_seconds_bucket[5m])))
          > 2
        for: 5m
        labels:
          severity: warning
        annotations:
          summary: "VectorAI DB REST p95 latency above 2s"
          description: "REST p95 latency is {{ $value }}s."

      - alert: VectorAIHighGRPCErrorRate
        expr: >
          sum(rate(actian_vectorai_grpc_responses_fail_total[5m]))
          /
          sum(rate(actian_vectorai_grpc_responses_total[5m]))
          > 0.05
        for: 5m
        labels:
          severity: warning
        annotations:
          summary: "VectorAI DB gRPC error rate above 5%"
          description: "{{ $value | humanizePercentage }} of gRPC calls are failing."

      - alert: VectorAIRecoveryModeActive
        expr: actian_vectorai_app_status_recovery_mode == 1
        for: 0m
        labels:
          severity: critical
        annotations:
          summary: "VectorAI DB is in recovery mode"
          description: "The engine has entered recovery mode and requires immediate attention."

      - alert: VectorAIHighMemoryUsage
        expr: actian_vectorai_memory_resident_bytes > 0.8 * 8589934592  # Replace with your memory limit in bytes
        for: 5m
        labels:
          severity: warning
        annotations:
          summary: "VectorAI DB memory usage above 80%"
          description: "RSS is {{ $value | humanize }}B, exceeding 80% of available memory."

      - alert: VectorAIMajorPageFaultsRising
        expr: rate(actian_vectorai_process_major_page_faults_total[5m]) > 10
        for: 5m
        labels:
          severity: warning
        annotations:
          summary: "VectorAI DB major page faults rising"
          description: "Sustained major page faults indicate memory pressure and potential disk paging."

      - alert: VectorAIFileDescriptorExhaustion
        expr: actian_vectorai_process_open_fds > 0.8 * 65536  # Replace with your system fd limit
        for: 5m
        labels:
          severity: warning
        annotations:
          summary: "VectorAI DB file descriptors approaching limit"
          description: "Open file descriptors at {{ $value }}, approaching 80% of system limit."

      - alert: VectorAIRebuildFailures
        expr: rate(actian_vectorai_rebuild_failed_total[1h]) > 0
        for: 0m
        labels:
          severity: warning
        annotations:
          summary: "VectorAI DB index rebuild failure detected"
          description: "One or more index rebuilds have failed in the last hour."
Two rules use environment-specific values you need to set before deploying. VectorAIHighMemoryUsage fires when RSS exceeds 80% of available memory, so replace 8589934592 with your actual memory limit in bytes. VectorAIFileDescriptorExhaustion fires when open file descriptors approach 80% of the system limit, so replace 65536 with the output of ulimit -n on your host.
VectorAIRecoveryModeActive and VectorAIRebuildFailures use for: 0m, meaning they fire immediately rather than waiting for a sustained condition. Recovery mode and rebuild failures need attention the moment they occur, not after a five-minute window.
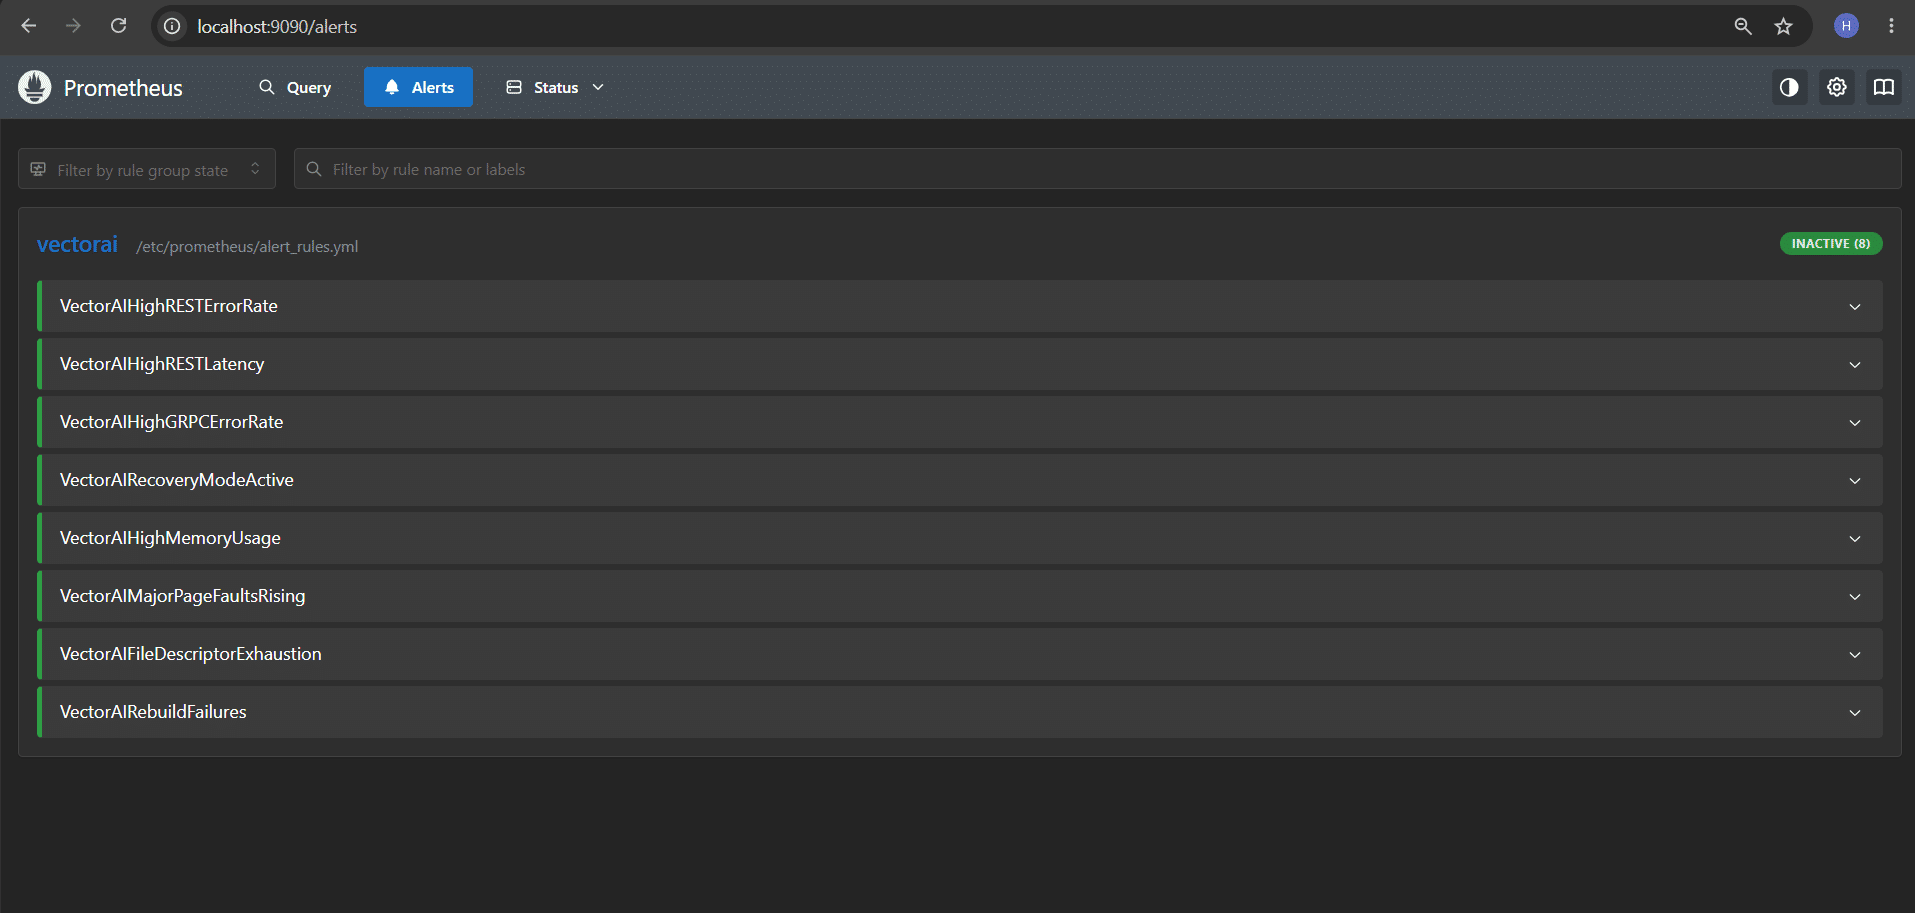
Verify all eight rules loaded cleanly by navigating to localhost:9090/alerts.
Validate Under Load
Run the load test script to generate real query traffic against your VectorAI DB instance. Add the following to scripts/load_test.py:
import random
import time
from concurrent.futures import ThreadPoolExecutor
from actian_vectorai import VectorAIClient, VectorParams, Distance

COLLECTION = "load_test"
DIMENSION = 128
TOTAL_QUERIES = 1000
RPS = 50
DURATION = 60

def random_vector(dim):
    return [random.uniform(-1, 1) for _ in range(dim)]

def run_query(client):
    try:
        client.points.search(
            collection_name=COLLECTION,
            vector=random_vector(DIMENSION),
            limit=10
        )
    except Exception as e:
        print(f"Query error: {e}")

def main():
    with VectorAIClient("localhost:6574") as client:
        try:
            client.collections.create(
                name=COLLECTION,
                vectors_config=VectorParams(size=DIMENSION, distance=Distance.Cosine)
            )
            print(f"Created collection: {COLLECTION}")
        except Exception as e:
            print(f"Collection {COLLECTION} already exists, continuing... ({e})")

        print(f"Running {TOTAL_QUERIES} queries at {RPS} req/s for {DURATION}s...")
        interval = 1.0 / RPS
        start = time.time()
        count = 0

        with ThreadPoolExecutor(max_workers=10) as executor:
            while count < TOTAL_QUERIES and (time.time() - start) < DURATION:
                executor.submit(run_query, client)
                count += 1
                time.sleep(interval)

        elapsed = time.time() - start
        print(f"Done. {count} queries in {elapsed:.1f}s ({count/elapsed:.1f} req/s)")

if __name__ == "__main__":
    main()
Then run it:
python scripts/load_test.pyThe script connects to VectorAI DB over gRPC on port 6574, creates a 128-dimension collection, and sends 1,000 random vector queries at 50 requests per second for 60 seconds. As the script runs, the request rate panel picks up traffic, p95 latency levels out, and the gRPC error ratio stays at zero.
To see the error ratio panel activated, query a collection that doesn’t exist:
from actian_vectorai import VectorAIClient

with VectorAIClient("localhost:6574") as client:
    try:
        client.points.search(
            collection_name="nonexistent_collection",
            vector=[0.1]*128,
            limit=5
        )
    except Exception as e:
        print(f"Error: {e}")
The gRPC error ratio panel spikes immediately. This sequence shows your team what the system looks like when it is working and when something goes wrong.
Three monitoring scenarios
The spike in request rate you saw during the load test is what peak traffic looks like on a product recommendation engine. When that spike occurs alongside rising p95 latency, the vector index is under memory pressure. The memory pressure panel catches it before it reaches the user.
Index rebuild failures in a medical imaging retrieval system silently degrade retrieval accuracy without throwing an error. The gRPC error ratio panel won’t catch them, but actian_vectorai_rebuild_failed_total and the VectorAIRebuildFailures alert will. The alert fires within one hour of any failure, and monitoring actian_vectorai_rebuild_duration_seconds tells you when index rebuilds, triggered by new data ingestion or model updates, are taking longer than expected.
The gRPC error ratio panel spiked to 0.952 in our test because 20 consecutive failed requests against a low baseline of successful ones pushed the ratio close to 1. That same signal is what a fraud-detection pipeline sees when authentication failures prevent real-time transaction lookups. Comparing transaction vectors against known fraud signatures requires sub-100ms query latency. When that panel turns red, the pipeline is already at risk.
Configure Structured Logging
Add the following to your VectorAI DB configuration to enable JSON-formatted logs compatible with Elasticsearch, Loki, or Datadog.
logging:
  format: json
  level: info
Set the log level based on your environment:
| Level | Use case |
| error | Production minimal: errors only |
| warn | Production with warnings |
| info | Production default |
| debug | Short-term troubleshooting only |
| trace | Development only |
Running at debug or trace levels in production generates a large volume of log data and can affect database performance. Use these levels only for short-term troubleshooting, then switch back to info.
Wrapping Up
You now have a monitoring stack that shows when vector search latency, memory pressure, or gRPC errors are moving before users feel it. Prometheus scrapes live metrics from port 6573; your four-panel Grafana dashboard covers the signals that matter; and eight alert rules fire the moment any of them crosses a threshold your team has defined.
Clone the GitHub repo to get the full stack: docker-compose.yml, prometheus/prometheus.yml, prometheus/alert_rules.yml, grafana/dashboard.json, and scripts/load_test.py. Import the dashboard JSON into Grafana, and the stack is ready.
For further details on the metrics endpoint and monitoring configuration, see the VectorAI DB monitoring documentation.

Stay connected
Data insights delivered to you.
(i.e. sales@..., support@...)
