Summary

  • Explains why data and AI observability are critical for reliable, fair, and accurate AI-driven decisions.
  • Defines the five pillars of data observability: freshness, volume, schema, distribution, and lineage.
  • Outlines how Actian Data Observability connects, monitors, alerts, and remediates data issues.
  • Highlights ML-driven anomaly detection, no-code monitoring, and human-in-the-loop collaboration.
  • Showcases Actian’s secure, scalable, and compliant observability architecture.

Organizations are increasingly relying on artificial intelligence (AI) to oversee or assist in managing data systems that inform decisions, drive automation, and enhance customer experiences. As these systems become more complex, observability (the ability to monitor, understand, and troubleshoot data and AI pipelines) has emerged as a critical concept. Data and AI observability ensure not only the health of systems but also the reliability, accuracy, and fairness of the insights they generate. 

Understanding Data Observability

Data observability refers to comprehensive visibility into the health and performance of data systems, encompassing data pipelines, quality, lineage, and infrastructure. At its core, it enables teams to detect and diagnose problems within data workflows before they impact downstream applications and users. 

This form of observability is essential in managing modern data architectures where data flows through multiple stages—from ingestion to transformation to analysis. When any part of this flow is compromised, such as through data corruption, schema changes, or delays, observability tools alert teams, enabling them to respond proactively. 

These are the five pillars of data observability. 

  • Freshness: Ensures that data is up to date and delivered on time. This pillar helps teams monitor latency and identify when pipelines are delayed or failing. 
  • Volume: Tracks the amount of data moving through pipelines to detect anomalies such as missing records or unexpected spikes, which may indicate upstream issues. 
  • Schema: Observes changes to data structure, including column additions, deletions, or type changes, which can break downstream processes if not properly managed.
  • Distribution: Analyzes statistical properties of data (e.g., mean, min, max) to spot outliers or data drift that could signal data integrity problems. 
  • Lineage: Provides visibility into data flow and dependencies, enabling teams to trace issues to their source and understand the impact of changes across systems. 

How Actian Data Observability Works

AI is not only a subject of observability, but a central component in the process. Through Actian Data Observability, organizations can ensure the overall health of their data systems and avoid cloud cost surges by leveraging Apache Spark-based, purpose-built cloud data architecture. Here’s how the process works. 

Step One: Connection to Data Sources

Actian’s data observability system connects to organizations’ existing data infrastructure, including data lakes, warehouses, and lakehouses. This includes over 250 connections to help ensure widespread data ingestion and observability over all data streams. 

“No-code” connection allows native support for raw and open table data formats as well, such as: 

  • Iceberg
  • Hudi
  • Delta 

Step Two: Continuous Data Monitoring

Once the system is connected to all sources of data, it performs comprehensive and continuous monitoring of the data ecosystem. Data health is analyzed and assessed according to the five pillars of data observability listed above. 

What makes this process different with Actian is: 

  • No-code analysis and reporting on data health.
  • Data lineage analysis for quick anomaly detection.
  • Anomaly detection driven by machine learning (ML) 

Step Three: Alerts and Human-in-Loop Collaboration

The third step in the process involves triage alerts. When any issue arises, the system sends alerts to the organization. Teams then become involved in the human-in-the-loop part of the process, working with the AI to resolve the problems. 

Step Four: Issue Remediation

Finally, the AI and human elements of the system work together to fine-tune data contracts (ensuring future consistency in formatting), manually fix data issues, or adjust the data quality workflow to both correct problems and avoid future ones.  

Key Components of Actian Data Observability

Now that we’ve discussed the steps in the ML-driven data observability process, let’s talk about a few of the key features of Actian’s product. 

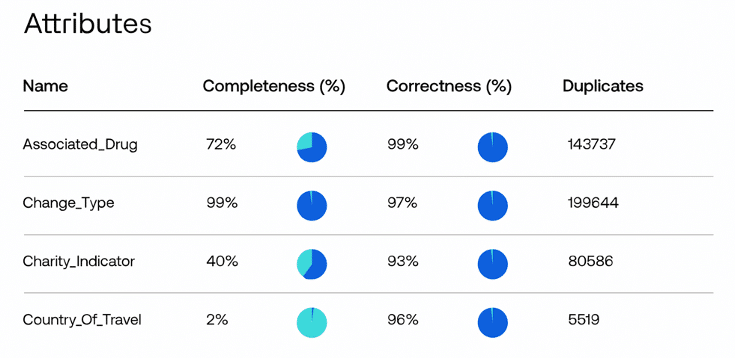
Data Health Dashboards and Quality Reports

Data health dashboards provide a high-level macroscopic view of every facet of the data pipeline. With automated data quality reports, teams receive key information on KPIs without the need for extended setup time. Additionally, they enable the automation of data quality workflows for scalable AI workloads. 

Consistency Through Data Layers

Actian Data Observability monitors data at all stages and layers, including bronze, silver, and gold layers. This helps catch potential issues in the bronze layer before they are propagated downstream in the silver and gold layers. Prevent problems in the consumption part of the data pipeline by identifying and addressing these issues early. 

Open, Scalable Architecture

Scalable cloud-based architecture means that organizations using Actian Data Observability don’t have to worry about cloud computing surges or spikes. In addition, the system fully integrates with over 250 data sources (both modern and legacy sources), third-party data catalogs, and engines for ticketing, workflow, and orchestration. 

Security and Compliance

Security and compliance are top concerns for most organizations when it comes to any data product or service. Actian utilizes a Virtual Private Cloud (VPC) to maintain all data within the organization’s virtual environment, which is secured through both at-rest and in-transit encryption. This approach ensures data safety through role-based permissions and authentication. Using AI observability, organizations can help ensure they stay compliant with industry regulations, including GDPR, CCPA, HIPAA, and PCI-DSS. 

Enhancing AI Observability With Actian

Actian offers tools that enhance AI observability by enabling real-time data processing, robust integration capabilities, and intelligent analytics. With Actian Data Observability, businesses can unify data sources and monitor AI performance with greater clarity and control. Schedule a full demonstration today. 


Blog | Data Intelligence | | 9 min read

ROI in Data: From Financial Justification to Value Creation

ROI in Data: From Financial Justification to Value Creation

As the year comes to an end, December becomes a pivotal moment for strategic and budget planning. This is when data executives — including CDOs/CDAIOs, heads of data, and analytics leaders — must translate technical ambition into clear financial language to secure funding for the next fiscal year.

In this context, metrics such as Return on Investment (ROI), Total Cost of Ownership (TCO), payback period, Internal Rate of Return (IRR), and Net Present Value (NPR) stop being purely financial concepts and become core elements of data strategy.

The challenge is that data initiatives have historically been justified qualitatively (e.g., “data is strategic” or “data is the new gold/oil/etc.”) rather than quantitatively. That approach no longer works:

As a result, data leaders must demonstrate clearly and credibly that investments in data:

  • Reduce operational and technology costs.
  • Increase productivity.
  • Enable new revenue streams.
  • Mitigate operational, regulatory, and compliance risks.

In short, ROI has become the common language between data leaders and finance. It ensures that data strategy is grounded in measurable financial KPIs rather than FOMO, or Fear of Missing Out, that’s fueled by hype and buzzwords that rarely survive beyond the next planning cycle.

Complementary Approaches to Calculating ROI in Data

  1. ROI of the Initiative as a Whole (Classic Financial and Strategic View) The most familiar and typically CFO-mandated approach is calculating ROI at the project or platform level.This answers the fundamental question:“If we invest X, what financial return do we get over time?”

    Classic ROI Formula
    roi current value of investment
    ROI is intuitive and easy to communicate, making it ideal for portfolio prioritization and executive decision-making. However, it should not be used in isolation.

    Payback Period: Why Time Matters
    The payback period measures how long it takes for cumulative benefits to offset the initial investment.
    • Shorter payback periods reduce financial risk.
    • They are especially attractive in uncertain economic conditions.
    • CFOs often use payback as a risk filter before looking at longer-term value metrics.

    For data and analytics programs, a payback under 18 to 24 months is often considered strong, particularly when benefits come from cost avoidance, productivity gains, or platform consolidation.

    Payback answers a simple but powerful question:

    “How fast do we get our money back?”

    Internal Rate of Return (IRR): Efficiency of Capital

    While ROI shows how much value is created, IRR shows how efficiently that value is created over time. IRR is the discount rate at which the Net Present Value (NPV) of all future cash flows equals zero. In simple terms, IRR indicates the rate of return a project or investment is expected to generate over a time period (typically one year).

    Put simply, IRR answers the question:

    “Is this investment growing fast enough to justify the money tied up in it?”

    Mathematically, IRR is the rate that satisfies:
    irr formula

    IRR is particularly useful when:

    • Comparing multiple initiatives with different lifespans.
    • Benchmarking against the company’s cost of capital.
    • Prioritizing investments competing for the same budget.

    If IRR exceeds the organization’s hurdle rate or Weighted Average Cost of Capital (WACC), the investment is financially attractive.

    ROI vs. IRR: When to Use Each

    Metric Best Used For Key Strength Limitation
    ROI Executive justification Simple, intuitive Ignores time value of money
    IRR Investment comparison Time-adjusted efficiency Less intuitive, harder to explain
    Payback Risk assessment Speed of return Ignores long-term value

    Together, these metrics provide a balanced financial narrative.

    Real-World Example: Actian at GEMA

    A concrete illustration is the GEMA case study, analyzed by Nucleus Research. By deploying the Actian Data Intelligence Platform, GEMA achieved:

    • 140% ROI.
    • 15-month payback period.
    • 94% IRR over three years.
    • Over €1M/year in technology cost savings.
    • €2.25M in productivity gains.
    • More than 400 certified data products and 11 AI models in production.

    This level of return was possible because the Actian platform acted not just as another tool, but as a value multiplier, enabling cost reductions, productivity gains, and monetization of data products and AI projects. This was only possible through governed, high-quality data and metadata — delivered by the platform through its flexible and lightweight data governance framework, laid out on its robust cloud-native architecture.

  2. ROI of the Data Itself (Tactical and Operational View) While project-level ROI secures funding, it does not answer a critical operational question: “Which data assets actually create value?”This leads to a second, increasingly important approach: ROI at the data-asset level. Instead of treating data platforms as monolithic investments, this approach evaluates ROI for:
    • Datasets
    • Dashboards and reports
    • Analytical models
    • Data products

    Common and practical methods include these five:

    1. Time Savings: Quantifying hours saved by analysts and business users through trusted, reusable data assets.
    2. Adoption and Reuse: Measuring how many teams/domains consume the same asset to avoid duplication, which reduces data storage and processing costs, and improves usability.
    3. Decision Enablement: Linking data assets to the operational, tactical, or strategic decisions they support, helping data teams prioritize initiatives based on business impact.
    4. Risk Reduction: Estimating avoided costs related to data errors, regulatory breaches, compliance issues, or misuse of sensitive data.
    5. Revenue Impact: Capturing direct data monetization or indirect effects on revenue drivers such as churn reduction, pricing optimization, and cross-sell opportunities.

    Taken together, this approach transforms data assets into measurable economic units, enabling value-driven prioritization rather than effort-driven delivery.

    However, achieving this in practice requires the definition of a dedicated ROI calculation methodology — either developed internally or adapted from existing market frameworks. In most cases, these frameworks must be tailored to the organization’s industry, business model, and data maturity, each bringing its own advantages and trade-offs.

    There is no off-the-shelf solution that can automatically calculate ROI for data assets in a standardized way. Each data asset may require a different ROI logic depending on factors such as its intended use cases, criticality to the business, regulatory exposure, and the specific industry or segment in which the organization operates. As a result, operationalizing data-level ROI is as much a governance and operating model challenge as it is a technical one.

  3. When Each Approach Applies—and Why Both are Required
    Scenario Project ROI Data-Asset ROI
    Budget approval ✅ Critical ⚠️ Supporting
    Strategic planning ✅ Critical ⚠️ Supporting
    Backlog prioritization ❌ N/A ✅ Critical
    Data mesh & data products ⚠️ Supporting ✅ Critical
    Value-based governance ❌ N/A ✅ Critical

    Bottom line:

    • Project-level ROI secures the CFO’s approval and justifies the initial investment.
    • Data-level ROI ensures sustained value realization over time.
    • Operationalizing data-level ROI requires a tailored methodology, not a one-size-fits-all solution, reflecting the unique context, use cases, and economic impact of each asset.

    How Actian Enables and Scales ROI in Data

    actian solution architecture for data roi

    Actian Solution Architecture for Data ROI

    Turning ROI from a theoretical exercise into a scalable, repeatable capability requires an architecture that connects data quality, cost signals, and business context into a single analytical flow. The solution architecture illustrated above shows how Actian enables this end-to-end.

    Rather than treating ROI as a one-time business case exercise, this approach embeds the ROI calculation directly into the data operating model, making it observable, explainable, and continuously updated.

    Data Observability: Quality Signals that Ground ROI in Reality

    Actian Data Observability — or equivalent solutions from other vendors — provides the foundational signals required to make the ROI calculation objective and defensible.

    By continuously monitoring datasets, pipelines, and data products, this layer generates data quality metrics such as freshness, completeness, accuracy, volume anomalies, and schema drift.
    data quality attributes

    Examples of Data Quality Metrics

    These metrics directly influence ROI in two ways. First, they expose hidden costs caused by poor data quality (reprocessing, rework, incident resolution, failed analytics, or AI pipelines). Second, they act as leading indicators of value because high-quality, reliable data drives adoption, reuse, and faster decision-making.

    Exposed via APIs and/or webhooks, these signals become structured inputs for ROI calculations, replacing subjective assessments with measurable evidence.

    Actian Data Intelligence: The Semantic and Governance Core of Data ROI

    Actian Data Intelligence Platform is the central nervous system of the architecture. It catalogs all data assets and enriches them with curated, governed metadata that gives ROI its business meaning. The platform also stores the ROI for all managed data assets, as shown by the custom properties highlighted in red in the image below.
    tracking dataset roi

    Tracking Dataset ROI on Actian Data Intelligence Platform With Custom Properties

    Beyond ownership, lineage, and certification, the platform integrates data quality metrics from observability tools and associates them directly with each asset. Through its business glossary and federated data catalogs, it also captures critical business context, such as asset criticality, regulatory exposure, domain ownership, and supported use cases.

    This context is made programmatically available via the Actian MCP Server, enabling ROI calculations to incorporate not just technical metrics, but business relevance. Without this layer, ROI would be reduced to infrastructure efficiency; with it, ROI becomes a business-aligned metric.

    ROI Engine: ROI Calculation and Aggregation at Scale

    Actian Data Platform acts as the analytical engine that operationalizes ROI.

    It ingests and aggregates signals from multiple sources — data observability tools, infrastructure monitoring platforms, and the Actian Data Intelligence Platform — and applies business rules, weighting models, and asset-specific formulas to compute ROI. This allows organizations to support multiple ROI methodologies in parallel, tailored by industry, domain, and/or asset type.

    The resulting ROI scores are continuously updated and pushed back to the Actian Data Intelligence Platform via APIs, where they become visible to data producers and consumers alike. This closes the feedback loop between data quality, usage, and value.

    From Justification to Continuous ROI Governance

    As previously explored, beyond generating ROI directly through its adoption, the Actian Data Intelligence Platform lays the foundation for a complete solution architecture that automates ROI measurement for managed data assets, connecting usage, quality, business impact, and financial value. Together, the components in the Actian Solution Architecture for Data ROI form a closed-loop solution that transforms ROI into an operational capability rather than a static justification exercise.

    In a world where AI initiatives consume growing portions of the data budget, success is no longer defined by experimentation, but by the ability to continuously prove value. That is the strategic role of Actian: turning data into governed, measurable, and profitable assets.