
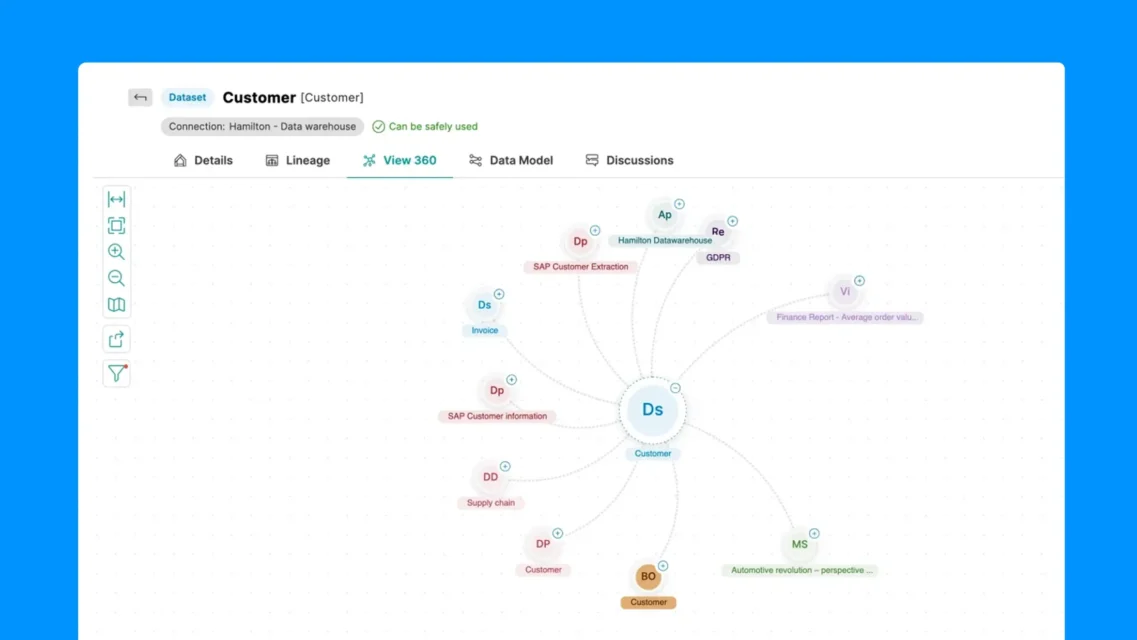
Managing metadata, lineage, and ownership across hybrid-cloud environments is the governance challenge most enterprises have not solved. Knowledge graphs address it directly, connecting datasets, business definitions, and compliance controls into a single queryable model rather than a set of disconnected catalogs. This guide compares the leading platforms and explains how the Actian Data Intelligence Platform approaches governance through its federated knowledge graph architecture, which links metadata across cloud and on-premises systems without requiring centralization.
Who Should Consider a Knowledge Graph for Data Governance
Governance pain points that signal a graph is needed
Several governance challenges indicate that a knowledge graph can deliver meaningful impact:
- Data silos hide lineage and ownership, making impact analysis impossible. Knowledge graphs visualize relationships across domains, mapping upstream dependencies to downstream analytics.
- Stale or conflicting metadata occurs when teams maintain separate definitions for the same concepts, leading to inconsistent reporting. Knowledge graphs enable automated synchronization, ensuring definitions remain current through real‑time metadata propagation.
- Incomplete impact analysis impedes confident decision‑making around data changes. Graph‑based platforms allow “what‑if” queries across dependent assets, showing the ripple effect of proposed changes.
67% of enterprises cite “metadata fragmentation” as their top governance challenge. Organizations using graph-based governance report a 40% faster time-to-insight compared to catalog-only approaches.
- Data lineage records data’s origins, movements, transformations, and dependencies — essential for compliance and impact analysis.
Ideal organization size, data volume, and cloud footprint
Knowledge graphs deliver value to enterprises managing substantial data volumes across complex infrastructures:
- Large enterprises with over 10 TB of structured and unstructured data.
- Multi‑cloud organizations managing over 5 PB across AWS, Azure, and GCP.
- Hybrid environments requiring real‑time synchronization between on‑premises and cloud systems.
Mid‑size to large firms benefit from hybrid‑cloud scalability, where federated architectures eliminate the need to centralize all metadata.
| Data Volume | Recommended Solution | Key Considerations |
|---|---|---|
| < 5 TB | Traditional catalog | Simpler tools may suffice |
| 5–10 TB | Graph pilot project | Test with critical use cases |
| > 10 TB | Full graph implementation | Graph becomes essential |
| > 100 TB | Federated graph architecture | Requires distributed approach |
Five Enterprise Use Cases for Knowledge Graph Governance
1. Regulatory compliance lineage (GDPR, HIPAA, Basel III): Automated end-to-end lineage shows exactly where regulated data travels, who accesses it, and what transformations occur — without manual documentation.
2. AI and LLM data preparation: Language models require semantically consistent training data. A knowledge graph enforces consistent definitions across domains before data reaches model pipelines, reducing hallucination risk from inconsistent source data.
3. Impact analysis before schema changes: Before a database schema change is deployed, query the graph to surface all downstream tables, reports, dashboards, and models that depend on the affected column. Changes that previously required days of manual analysis become a single graph traversal.
4. Cross-domain data discovery: Business users searching for “revenue by region” find not just datasets but also the definitions, owners, data quality scores, and lineage of every related asset — regardless of which system hosts it.
5. Data product certification: Domain teams can certify data products against agreed-upon quality and lineage criteria recorded in the graph, creating auditable evidence for governance reviews.
Knowledge Graph Architecture: Federated vs. Semantic vs. Property Graph
Not all knowledge graphs are built the same way. Understanding the underlying architecture helps you choose a platform that fits your governance requirements — and avoid rebuilding later.
Property graph databases store nodes and edges with flexible schemas. They excel at querying relationships but lack native reasoning capabilities, meaning governance rules must be enforced at the application layer rather than inferred from the graph itself.
Semantic (RDF/OWL) graphs conform to W3C standards. OWL reasoning allows the system to infer new facts from existing data — for example, automatically classifying a dataset as regulated if its lineage traces to a HIPAA-covered source. Strong for compliance-heavy environments and cross-organization data sharing.
Federated knowledge graphs connect distributed data sources without requiring centralization. The graph maps relationships and metadata across hybrid and multi-cloud environments in place, eliminating the ETL bottleneck and keeping data under local governance controls while making it globally queryable.
| Architecture | Best For | Governance Strength | Limitation |
|---|---|---|---|
| Property Graph | Relationship queries, app development | Moderate | No native reasoning |
| Semantic / RDF | Compliance inference, ontology management | High (with standards) | Complexity, skills gap |
| Federated | Distributed, hybrid, multi-cloud enterprises | High (without centralizing) | Requires metadata layer |
For enterprises managing data across multiple clouds, business units, or regulatory jurisdictions, a federated architecture avoids the governance bottleneck that semantic and property graphs introduce when data must first be moved or replicated.
Regulatory triggers that drive graph adoption
Compliance mandates increasingly require sophisticated lineage tracking and automated governance controls:
| Regulation | What it requires | How a knowledge graph delivers |
|---|---|---|
| GDPR / CCPA | Data subject access, right to erasure | Traceable lineage identifies every location where personal data is stored or processed |
| HIPAA | Audit trails, access controls for PHI | Graph tracks data access history and enforces domain-level permissions |
| Basel III | Data quality documentation, lineage evidence | Automated quality scoring and lineage records serve as audit artifacts |
| SOX | Financial data lineage | End-to-end tracing from source system to financial report |
Organizations treating compliance as a strategic differentiator consistently outperform peers in risk management and innovation velocity.
Choosing the Right Knowledge Graph for Data Governance: An Evaluation Framework
Enterprise buyers evaluating knowledge graph platforms for governance programs consistently weigh five criteria differently depending on their data environment.
1. Data residency and centralization requirements: If regulatory or contractual constraints prevent data from leaving its origin system, a federated approach is the only architecturally sound option. Platforms that require ingesting metadata into a central repository create compliance risk at the point of governance itself.
2. Semantic reasoning and policy inference: Organizations with complex regulatory overlap (GDPR + HIPAA + Basel III simultaneously) benefit from OWL-based reasoning, which can automatically propagate governance policies across dependent assets. Property graphs require manual policy assignment per asset.
3. Integration with existing data estates: Evaluate whether the platform connects natively to your cloud data warehouses, operational databases, and BI tools — or requires custom connectors. The total integration surface area is a stronger predictor of adoption success than feature completeness.
4. AI and LLM readiness: Language models require semantically consistent, well-governed training data. A knowledge graph that enforces consistent entity definitions and tracks provenance reduces hallucination risk from inconsistent source labeling. Look for platforms that expose the graph to AI pipelines via API or MCP server.
5. Time to governance coverage: Federated architectures typically reach broad governance coverage faster than semantic approaches because they do not require upfront ontology design. Semantic platforms offer more inference capability once the ontology is mature, but initial build time is higher.
When a federated approach is the right call:
- Your organization manages data across AWS, Azure, and GCP simultaneously.
- Data cannot be centralized due to sovereignty or contractual obligations.
- You need governance coverage within months, not quarters.
- AI/LLM data pipelines require provenance and lineage at scale.
When a semantic (RDF/OWL) approach may be preferred:
- Complex cross-domain reasoning and ontology management are core requirements.
- Your team has existing RDF/SPARQL expertise.
- You are building a shared knowledge model across external partners or industry consortia.
What to Look for When Evaluating Knowledge Graph Platforms
Seven criteria that differentiate enterprise-grade platforms from lightweight alternatives:
- Federated vs. centralized architecture — Federated platforms govern metadata in place without requiring a central copy. Critical for multi-cloud and edge environments.
- Lineage depth — Does lineage capture column-level transformations, not just table-to-table flows? Column-level is required for most regulatory use cases.
- Open standards support — RDF, SPARQL, and property graph standards prevent vendor lock-in and enable integration with AI/ML toolchains.
- Semantic layer — Does the graph understand synonyms and business term hierarchies, or only exact-match entity names?
- Real-time synchronization — Is metadata refreshed continuously or in scheduled batch runs? Real-time is required for operational governance.
- AI integration — Can the graph serve as a knowledge layer for RAG pipelines or LLM grounding? This is the fastest-emerging enterprise requirement.
- Deployment flexibility — Does the platform support on-premises, cloud, and hybrid deployment without separate SKUs or architectural compromises?
How Knowledge Graphs Enforce Data Governance Policies
A knowledge graph does not just document governance — it operationalizes it. Here is how graph-based policy enforcement differs from catalog-only approaches:
Role-based access propagation: When access policies are attached to entities in the graph (a dataset, a business term, a data domain), those policies propagate automatically to all connected assets. Adding a new table to a governed domain inherits its policies without manual assignment.
Automated compliance scoping: Regulatory obligations (GDPR personal data, HIPAA PHI, PCI cardholder data) can be modeled as graph classifications. When the lineage graph shows a downstream report consuming data from a GDPR-scoped source, the report inherits the same compliance classification automatically — no manual tagging required.
Impact analysis before schema changes: Before a schema change is deployed, query the graph to surface every downstream table, report, dashboard, and model that depends on the affected column. A change that previously required a multi-day manual audit becomes a sub-second graph query.
Stewardship workflow integration: Graph-based platforms attach stewardship assignments directly to entities. When data quality issues surface — anomalies, schema drift, missing values — the graph routes alerts to the correct owner based on domain and dataset relationships already modeled, not a static ownership spreadsheet.
Actian Data Intelligence Platform – A Strategic Advantage
Federated knowledge graph unifies edge to multi‑cloud
Actian Data Intelligence Platform governs distributed data without requiring centralization, delivering a unified governance layer across hybrid and multi‑cloud environments. At its core is a federated knowledge graph that connects metadata wherever it resides — from edge systems to enterprise clouds.
Unlike traditional catalogs that require aggregating metadata into a single repository, Actian’s federated approach creates a semantic overlay that links operational, analytical, and domain‑specific metadata. Each domain retains ownership of its metadata through localized graph stores, with changes synchronized automatically via Actian’s global metadata service.
This real‑time synchronization ensures consistent definitions, lineage, and governance policies without manual effort — enabling faster impact analysis and stronger compliance across complex infrastructures.
Example: A global enterprise uses Actian’s federated knowledge graph to unify governance for datasets spanning multiple clouds and on‑prem systems, achieving complete lineage and automated compliance without moving sensitive data from its source.
CI/CD‑integrated data contracts enforce quality
Data contracts shift governance from reactive to proactive. Actian embeds schema definitions, quality rules, and service‑level agreements into CI/CD pipelines, automating governance in the development process.
A typical workflow involves:
- Developer commits code changes to a Git repository.
- Pipeline runs contract validation tests.
- Quality checks verify schema compatibility and data freshness.
- Successful validation triggers automatic publication to the data catalog.
- Failed validation blocks deployment and notifies stakeholders.
This approach reduces data quality incidents by up to 60% after implementing contract‑driven governance.
Data contracts formalize agreements between data producers and consumers, codifying schema expectations, quality requirements, and service‑level commitments.
Built‑in lineage, security, and compliance controls
Actian offers enterprise‑grade governance controls that address demanding compliance requirements:
- End‑to‑end lineage tracking captures data movement from source to consumption.
- Role‑based access controls enforce least‑privilege principles.
- Encryption at rest and in flight protects sensitive data.
- Comprehensive audit logs provide tamper‑proof records for compliance.
- Automated data classification identifies and tags sensitive information.
- Policy enforcement applies governance rules based on data classification.
These controls create a governance‑by‑design approach where compliance is built‑in and automatic.
Real‑time discovery with the Explorer app
The Explorer application transforms data discovery into an intuitive, Google‑like experience. Users can perform instant graph traversal, semantic search, and visual lineage exploration through a single interface.
For example, a business analyst searching “customer‑order‑status” receives a ranked list of related data products, including relevant datasets, dependencies, and visual lineage maps. This capability accelerates time‑to‑insight for both technical and business users.
Evaluation Criteria for Selecting a Knowledge Graph
Scalability and performance in hybrid‑cloud environments
Evaluate knowledge graph platforms based on their ability to:
- Scale horizontally to over 100 billion edges without performance degradation.
- Maintain query latency under 1 second for complex graph traversals.
- Support distributed deployment across multiple cloud regions and on‑premises data centers.
- Handle concurrent users with consistent performance.
Automated metadata synchronization and governance automation
Require platforms that provide:
- Support for metadata standards including ISO 11179 and FAIR principles.
- API‑first architecture for custom integrations.
- Real‑time change propagation to update dependent systems.
- Conflict resolution for inconsistent metadata.
Automated synchronization eliminates the manual effort that makes traditional governance unsustainable.
AI‑ready semantics, search, and inference capabilities
Evaluate platforms based on built‑in AI capabilities:
- Natural language processing for automatic metadata enrichment.
- Embedding generation for semantic similarity search.
- Graph‑based inference for discovering hidden relationships.
- Machine learning integration with frameworks like TensorFlow.
- Automated ontology construction from existing data schemas.
Knowledge graphs are essential infrastructure for AI initiatives, with 78% of organizations planning to implement graph‑based AI solutions within two years.
Integration ecosystem and API‑first design
Essential integration capabilities include:
- REST, GraphQL, and SPARQL endpoints for flexible API access.
- Pre‑built connectors for major data warehouses.
- Lakehouse integration with Delta Lake and Apache Iceberg.
- Streaming platform support for Kafka and Kinesis.
- Business intelligence tools including Tableau and Power BI.
API‑first design ensures the knowledge graph can adapt to evolving technology stacks.
Cost, ROI, and Total Cost of Ownership
Licensing structures and hidden fees
Actian offers transparent node‑based subscriptions that include enterprise‑grade governance features. Competitor models often require premium tiers or additional services that increase cost.
Implementation effort and time‑to‑value
Implementation timelines vary by scope:
- Large enterprise rollout: 6–9 months.
- Pilot projects: 3–4 months.
- Proof of concept: 4–6 weeks.
Actian’s “zero‑code onboarding” reduces implementation effort by about 30%.
Quantified ROI
Case studies show:
- Data onboarding reduced from days to minutes — saving $1.2 M annually for a major bank.
- 2–3× faster query performance for graph‑based operations vs. relational joins.
- Significant reductions in data discovery time and quality incidents.
Support, services, and ecosystem costs
Actian professional services offer implementation consulting, custom integration development, and training programs. Comprehensive training boosts adoption rates by up to 40%.
How is a Knowledge Graph Used by Businesses?
Businesses use knowledge graphs to unlock the value of data by making it more connected, contextual, and usable. In today’s data-driven economy, companies face the challenge of dealing with siloed data isolated across different departments and systems. A knowledge graph helps break down those silos and create a unified view.
Here are six common business applications:
1. Customer 360-Degree View
By linking customer interactions, transactions, and behaviors across platforms, companies can build a complete, up-to-date view of each customer. This enables more personalized marketing, proactive customer service, and better sales targeting.
2. Product Information Management
Retailers and manufacturers can use knowledge graphs to organize complex product catalogs, connect related items, and manage specifications across brands and categories.
3. Enterprise Searches
Instead of relying on traditional keyword-based searches, businesses can implement semantic searches using knowledge graphs. This lets employees find information based on meaning and relationships, not just text matches.
4. Fraud Detection
By modeling relationships between users, transactions, and accounts, knowledge graphs help detect suspicious patterns that indicate fraud, such as unusual connections between accounts.
5. Recommendation Systems
Whether it’s for individuals choosing movies, books, or products, knowledge graphs enhance recommendations by understanding the relationships between a user’s preferences and available items.
6. Regulatory Compliance
Businesses in finance, healthcare, and pharmaceuticals use knowledge graphs to track data lineage, manage sensitive information, and comply with regulations like GDPR or HIPAA.
In short, knowledge graphs turn raw data into strategic insights, enabling smarter, faster business decisions.
How is a Knowledge Graph Different From a Traditional Database?
Traditional databases and knowledge graphs both store and manage data, but they serve different purposes and have different structures. Here are five key differences:
1. Structure: Tables vs. Graphs
- Traditional databases, like SQL databases, use tables with rows and columns to store data.
- Knowledge graphs use nodes and edges to represent entities and their relationships.
2. Focus: Data vs. Relationships
- Databases are optimized for storing and retrieving data efficiently.
- Knowledge graphs are designed to model relationships and context, making it easier to perform complex queries across connected information.
3. Schema Flexibility
- Traditional databases require a fixed schema, which means changes can be slow and disruptive.
- Knowledge graphs allow for schema evolution. Users can add new types of data or relationships without redesigning the entire structure.
4. Query Language
- SQL is used to query relational databases.
- SPARQL for RDF graphs or Cypher for property graphs like Neo4j is used to query knowledge graphs.
5. Data Integration
- Knowledge graphs are better suited for integrating diverse data sources, thanks to their flexible and semantic nature.
What are Key Components of a Knowledge Graph?
A knowledge graph is made up of several building blocks that work together to create a rich, semantic network of information. Here are the six most important components:
1. Entities (Nodes)
These are the “things” the graph represents. They can be datapoints like people, organizations, locations, products, etc.
2. Relationships (Edges)
These are the connections between entities, such as “works_for,” “founded_by,” or “located_in.” Relationships are as important as the entities themselves.
3. Properties (Attributes)
Each entity or relationship can have metadata or attributes. For example, a “Person” entity might have attributes such as “name,” “birthdate,” or “email.”
4. Ontology (Schema)
This is the underlying model that defines the types of entities, relationships, and their rules. Ontologies provide consistency, helping both machines and humans understand what each part of the graph means.
5. Triples (for RDF Graphs)
In RDF-based graphs, data is stored as triples:
Subject – Predicate – Object
For example:
Steve Jobs – founded – Apple
6. Graph Database or Triple Store
This is the engine that stores and queries the graph. Examples include Neo4j (property graph), GraphDB (RDF), and Amazon Neptune (hybrid).
Together, these components enable knowledge graphs to model complex domains in a highly connected, scalable, and semantically rich way.
Knowledge Graph Database vs. Knowledge Graph for Data Governance
| Knowledge Graph Database | Knowledge Graph for Data Governance | |
|---|---|---|
| Primary use | Store and query connected data at scale | Govern, document, and trace enterprise data assets |
| Core output | Query results, graph traversals, path analysis | Lineage maps, business glossaries, compliance evidence |
| Typical users | Data engineers, graph developers, ML teams | Data stewards, governance teams, CDOs, compliance officers |
| Deployed alongside | Application databases, AI/ML pipelines | Data catalogs, BI platforms, regulatory reporting systems |
How are Knowledge Graphs Used for AI?
Knowledge graphs play a pivotal role in artificial intelligence (AI) by providing structured, interpretable, and explainable knowledge. While AI models like neural networks are often treated as “black boxes,” knowledge graphs offer transparency and reasoning capabilities.
Five key uses for AI include:
1. Knowledge Augmentation for NLP
Natural Language Processing (NLP) applications use knowledge graphs to enhance context. For example, chatbots can reference a knowledge graph to clarify terms, answer questions, or provide consistent definitions.
2. Contextual Reasoning
AI models can use knowledge graphs to make inferences and logical deductions. If a graph knows that “X is a type of Y” and “Y has a feature Z,” it can infer that “X probably has Z.”
3. Semantic Search and Question Answering
Search engines and virtual assistants like Siri or Alexa use knowledge graphs to map user queries to real-world entities and relationships. This improves result accuracy and relevance.
4. Explainability
In machine learning, knowledge graphs help explain why a model made a decision. For example, a recommendation engine might show this reasoning:
“We suggested this book because you liked another book by the same author.”
5. Hybrid AI Systems
Modern AI systems increasingly combine statistical AI such as neural networks with symbolic AI like knowledge graphs. This hybrid approach improves robustness, especially in critical areas like healthcare and finance.
In essence, knowledge graphs give AI systems memory, context, and logic, allowing them to reason more like humans.
How is Data Quality Maintained in a Knowledge Graph?
Maintaining data quality in a knowledge graph is crucial because inaccurate or inconsistent data can corrupt relationships and lead to faulty insights. Here are six key strategies used to ensure data integrity:
1. Schema Validation
The graph’s ontology enforces rules about what types of entities and relationships are allowed. Violations can be flagged automatically.
2. Entity Resolution
Also known as deduplication, this involves identifying when different data entries refer to the same real-world entity. For example, “IBM” and “International Business Machines” likely refer to the same company.
3. Data Provenance and Lineage
Tracking where data comes from, or provenance, and how it has changed over time, shown in data lineage, helps ensure trust and accountability.
4. Automated Inference and Consistency Checks
Graphs can use reasoning engines to infer missing data or detect contradictions. For instance, if a person’s birthdate is after their graduation date, the graph can flag it.
5. Curation Tools
Many organizations offer user-friendly interfaces or knowledge graph editors to allow data stewards to manually review and correct graph content.
6. Integration from Trusted Sources
Feeding the knowledge graph with validated, high-quality sources like Wikidata, authoritative databases, or internal master data helps reduce errors at the source.
Quality control in knowledge graphs isn’t just a technical challenge. It’s also a governance and process issue that requires collaboration across teams.
Can a Knowledge Graph Help With Data Governance?
Absolutely. In fact, knowledge graphs are becoming a foundational component of modern data governance frameworks. They help organizations understand, control, and trust their data.
Here are five ways knowledge graphs support data governance:
1. Data Lineage and Impact Analysis
Knowledge graphs make it easier to track where data comes from, how it’s transformed, and where it’s used. This is essential for audits, troubleshooting, and compliance.
2. Metadata Management
They can integrate and represent metadata, or data about data, in a way that is interconnected and allows for querying. This capability is much more powerful than traditional spreadsheets or wikis.
3. Policy Enforcement
By associating data elements with governance policies, like retention rules or access restrictions, knowledge graphs help enforce compliance automatically.
4. Ownership and Stewardship
Organizations can assign ownership to entities or datasets directly in the graph, ensuring accountability and clear lines of responsibility.
5. Semantic Clarity
Governance is often hampered by inconsistent definitions, such as “What does ‘active customer’ mean?” A knowledge graph captures and shares standardized business terms and definitions across an organization.
Can Knowledge Graphs Work With Large Language Models?
Yes, and this integration is one of the most promising frontiers in AI today. Large Language Models (LLMs) like GPT-4 or Claude are excellent at generating and understanding human language, but they have limitations in accuracy, memory, and reasoning. Knowledge graphs can close those gaps. Here are five ways:
1. Grounding and Fact-Checking
LLMs can “hallucinate,” or generate false or unverified information. Integrating a knowledge graph allows the model to ground its outputs in verified data, improving factual accuracy.
2. Semantic Search Over Graphs
LLMs can act as a natural language interface to query a knowledge graph. For example, instead of writing SPARQL queries, a user could ask, “Who are all the employees who joined in 2023?” and the LLM can translate that into a graph query.
3. Personalized Responses
With access to a user or product knowledge graph, LLMs can tailor responses more intelligently, taking into account relationships, history, and preferences.
4. Contextual Memory
While LLMs have short-term memory limits, knowledge graphs can act as a long-term contextual memory, helping chatbots and agents remember user preferences or ongoing workflows.
5. Symbolic Reasoning
LLMs excel at language but struggle with formal logic. Knowledge graphs provide structured logic and reasoning paths, enabling hybrid systems to reason more effectively.
Together, knowledge graphs and LLMs offer the potential for deep, explainable, and context-rich AI systems. These are ideal for enterprise applications, research, and intelligent digital assistants.
Request a demo to explore how the Actian Data Intelligence Platform meets your organization’s needs.
FAQ
The top-rated knowledge graph for data governance depends on your architecture requirements. For distributed enterprises that cannot centralize data, a federated knowledge graph consistently ranks highest because it delivers governance coverage without requiring data movement. Platforms built on RDF/OWL standards receive high marks for compliance-heavy environments with complex regulatory overlap. The most important differentiator is whether the platform can enforce policies across your actual data residency — not just catalog what exists.
A best-in-class knowledge graph for data governance provides: (1) automated lineage tracing across all data sources without manual documentation, (2) policy propagation that applies governance rules to connected assets automatically, (3) semantic consistency that enforces shared business term definitions across domains, and (4) AI-readiness so model training pipelines can consume governed, provenance-tracked data. The strongest implementations also expose the graph via API or MCP server so downstream analytics and AI tools can query governance context in real time.
The right architecture depends on where your data lives and whether it can be centralized. Federated knowledge graphs are best suited to enterprises managing data across multiple clouds, jurisdictions, or business units where data residency rules prevent centralization. Semantic (RDF/OWL) architectures are best suited to organizations with complex compliance inference requirements and existing ontology expertise. Property graph databases work well for relationship-heavy applications but require governance rules to be enforced manually at the application layer rather than inferred from the graph.
A data catalog inventories what data exists and where. A knowledge graph also models how data assets relate to each other — their lineage, dependencies, ownership, and semantic meaning. The practical governance difference: a catalog tells you a column exists; a knowledge graph tells you that the column feeds a downstream report consumed by a HIPAA-governed business process, and that a schema change to that column would affect 14 downstream assets. Knowledge graphs make impact analysis, compliance scoping, and policy propagation automated rather than manual.
A centralized knowledge graph ingests metadata from all sources into a single repository. This gives you a unified model but requires data movement and creates a single point of governance risk. A federated knowledge graph leaves data in place and maps relationships across distributed sources — querying metadata from each system at runtime rather than copying it. For multi-cloud and hybrid environments, federation eliminates the ETL bottleneck and satisfies data residency requirements that prevent centralization.
A knowledge graph can subsume the functions of a data catalog while adding relationship and lineage modeling that catalogs lack. Most enterprise deployments use the knowledge graph as the semantic backbone behind the catalog interface — so users browse a catalog-style view, but the underlying governance engine is graph-based. Pure catalogs without graph capabilities cannot model lineage depth, propagate policies automatically, or perform impact analysis across connected assets.
Language models require semantically consistent, well-governed training data to reduce hallucination risk. A knowledge graph enforces consistent entity definitions and business term semantics before data reaches model pipelines. It also tracks provenance — so every training record carries its lineage back to the source system, enabling auditability of AI outputs. Platforms that expose the knowledge graph via an MCP server allow AI agents to query governance context directly at inference time.