How to Evaluate Vector Databases in 2026


Summary
- Most vector database benchmarks are vendor-optimized and fail to reflect real-world production conditions like concurrency, filtering, and continuous ingestion.
- Key production risks include tail latency (P95/P99), performance degradation over time, and rising total cost of ownership at scale.
- The industry is shifting toward “vector as a feature,” favoring integrated platforms like PostgreSQL + pgvector or Actian VectorAI DB over standalone vector databases.
- Effective evaluation requires real-world testing with high-dimensional data, concurrent workloads, and long-term cost modeling.
In 2026, a synthetic performance crisis challenges the vector database market. A GitHub search for “vector database benchmark” reveals polished repositories with dashboards and performance charts. However, vendors often build these tools to evaluate their own products and portray architecture-specific strengths as objective comparisons.
Zilliz maintains VectorDBBench. Redis and Qdrant publish benchmark suites that highlight their own systems. Even widely cited Approximate Nearest Neighbor (ANN) evaluations, such as ANN-Benchmarks, rely on low-dimensional datasets such as Scale-Invariant Feature Transform (SIFT) and Generalized Search Trees (GIST). Modern Large Language Model (LLM) embeddings often reach 3,072 dimensions. These benchmarks do not reflect that reality.
Leaderboards reward performance under static conditions, yet production systems must survive continuous writes, metadata filters, and concurrency spikes. As software engineer Simon Frey famously noted in a viral post: “The best vector database is the one you already have.” This captures the 2026 market shift, prompting teams to move from specialized silos toward the databases they already trust and operate.
This guide takes a production-first approach. We define the five critical tests for 2026 and explore why your optimal vector database may already exist within your current architecture, whether that is PostgreSQL with pgvector or an enterprise hybrid engine like Actian VectorAI DB.
TL;DR
- The bias: Most benchmark suites originate from vendors and optimize for narrow architectural advantages.
- The reality: Production workloads include continuous ingestion, metadata filtering, and concurrency spikes that synthetic tests ignore.
- The risk: Tail latency (P99), index fragmentation, and write amplification degrade systems long before average QPS drops.
- The cost curve: Managed vector services often introduce nonlinear pricing as the dataset size increases.
- The direction: 2026 favors integrated platforms, from established relational extensions (PostgreSQL + pgvector) to enterprise hybrid systems (Actian VectorAI DB), over “vector-only” silos.
Why Every Benchmark You’ve Seen is Vendor-Optimized
Benchmarks create a perception of objectivity but often encode architectural assumptions. Tools like VectorDBBench (Zilliz) reward distributed scaling, while Redis and Qdrant suites emphasize in-memory operations. To find objective data, architects must look to peer-reviewed academic conferences such as NeurIPS and VLDB (Very Large Databases), which prioritize algorithmic rigor over marketing.
Before examining what matters in production, it helps to understand how common benchmark tools shape outcomes.
| Benchmark tool | Primary creator | Optimization focus | Typical bias |
|---|---|---|---|
| VectorDBBench | Zilliz (Milvus) | High-throughput scaling | Favors massive clusters; penalizes single-node systems. |
| vector-db-benchmark | Redis/Qdrant | In-memory operations | Favors RAM-heavy architectures; ignores TCO of memory. |
| ANN-Benchmarks | Academic | Raw algorithm efficiency | Uses outdated, low-dimensional datasets (SIFT/GIST). |
| NeurIPS / VLDB | Academic Peers | Algorithmic robustness | Focuses on math/theory; ignores operational/SLA reality. |
The Hidden Rules of Benchmarking
A significant hurdle is the “DeWitt Clause,” a legal provision in many End User License Agreements (EULAs) that prohibits users from publishing independent benchmarks without the vendor’s permission. In 2024, BenchANT found that 30% of the major vector databases legally prohibit disclosure that their products are slow.
Furthermore, these benchmarks often operate at “Time Zero,” the artificial window immediately following ingestion but preceding live updates. In production, systems must constantly insert and delete data, forcing the index to re-optimize in real time. Vendor benchmarks often omit the Out-of-Memory (OOM) failures that result.
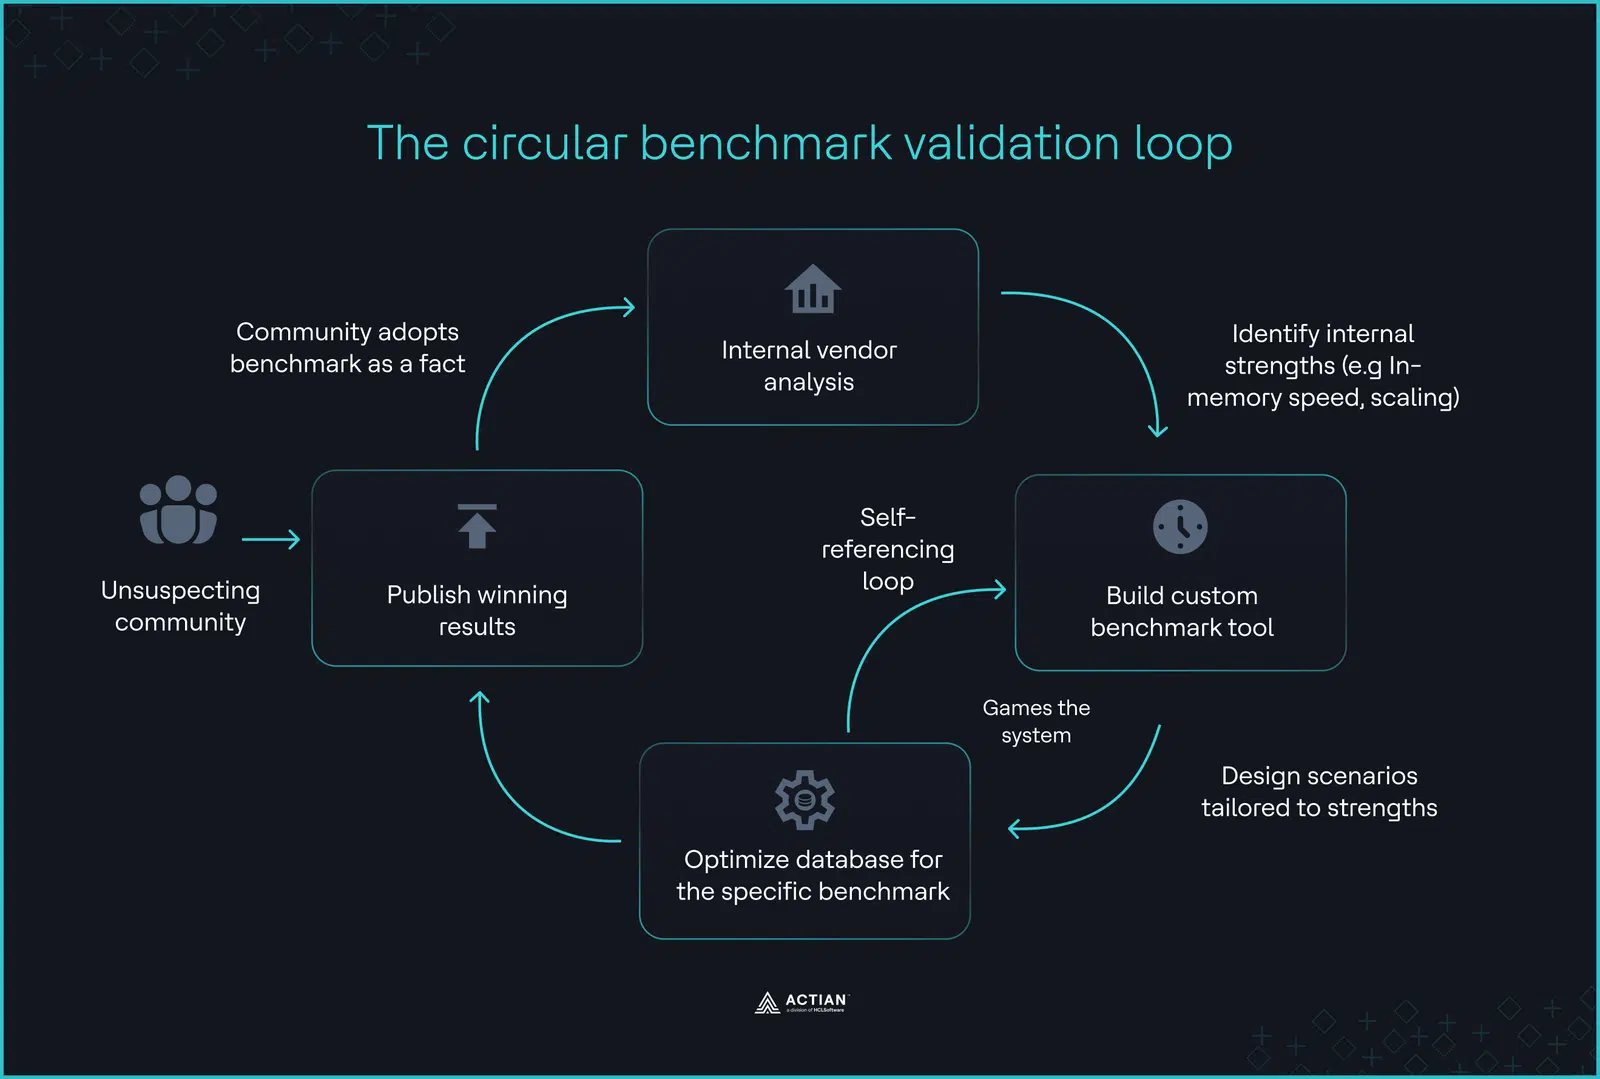
The circular validation loop
The Five Production Tests That Actually Matter
Most benchmarks measure performance after loading data, before any real updates occur. But production is a nonstop, unpredictable process. To find a database that can handle real users, you should run these five stress tests.
1. Filtering under concurrent load
Pure vector similarity searches are rare in real life. In production, you’re more likely to search for something like “Product recommendations WHERE category is ‘shoes’ AND stock > 0.”
Reddit’s engineering team, managing 340M+ vectors, identified metadata filtering as the primary performance bottleneck in their 2025 deployment. They found that as concurrent users grew, the database spent more time resolving metadata filters than calculating similarity distances.
- The reality: Production means 100+ concurrent clients hitting different metadata subsets.
- The gap: VectorDBBench only tests with a single client. In real-world situations, moving data between the vector graph and the relational metadata store can cause P99 latency to jump by 10x, as the CPU waits for disk I/O.
2. Performance degradation over time
While archival retrieval-augmented generation (RAG) systems can technically use static knowledge bases, production-grade applications in 2026 must reflect real-time data, such as customer tickets or product inventory. As the engineering team at Milvus admitted, “Benchmarks test after data ingestion completes, but production data never stops flowing.” If the database cannot re-index as quickly as it ingests data, your AI may provide stale or incorrect answers for hours.
Benchmarks that omit a “72-hour continuous write-and-query” test provide zero value. You must determine whether query performance degrades after six months of continuous index maintenance.
3. Tail latency under load (P95/P99)
Average latency can be misleading and doesn’t show what users really experience. For example, a 10ms average response time doesn’t help if your slowest 1% of queries (P99) take 800ms. This makes your AI agent seem slow and unreliable. Only high-concurrency tests reveal these spikes, which often happen during garbage collection or index locking.
4. Total cost of ownership (TCO)
In 2025, managed vendors introduced complex “read unit” pricing. This created a “Growth penalty”: if your index grows from 10GB to 100GB, you may pay 10x as much for the same query result.
| Scale metric | Managed Vector DB (usage-based) | Integrated/Hybrid platform | TCO impact |
|---|---|---|---|
| Initial (10GB) | High (Platform fee + usage) | Moderate (Fixed resource) | Integrated is ~40% lower |
| Growth (100GB) | High (Scales with volume) | Low (Vertical scaling) | 8x cost gap |
| Enterprise (1TB+) | Prohibitive (Linear growth) | Optimized (Reserved capacity) | 90%+ long-term savings |
This economic reality primarily drives the market’s shift toward “Vector as a Feature,” in which teams prioritize on-premises capabilities and predictable scaling over usage-based silos.
5. Operational maturity
Benchmarks ignore the “Operational Support Tax,” which quantifies the cost and risk of maintaining specialized infrastructure. You can easily find a PostgreSQL expert because the community has thrived for 30 years, but hiring someone proficient in a niche, three-year-old vector database often creates a bottleneck.
Evaluate the ecosystem: Does the database work with standard backup tools? Can it integrate with Prometheus? How long does it take to rebuild an index after a crash?
Here’s how benchmark claims compare to production reality.
| Metric | Benchmark focus | Production reality |
|---|---|---|
| Ingestion | Static QPS after completion | Sustained QPS during continuous writes |
| Latency | Average latency | P95/P99 Latency under concurrent load |
| Filtering | Single-client filtered search | 100+ Concurrent metadata-filtered queries |
| Cost | Infrastructure cost per query | TCO at 100M+ queries/month |
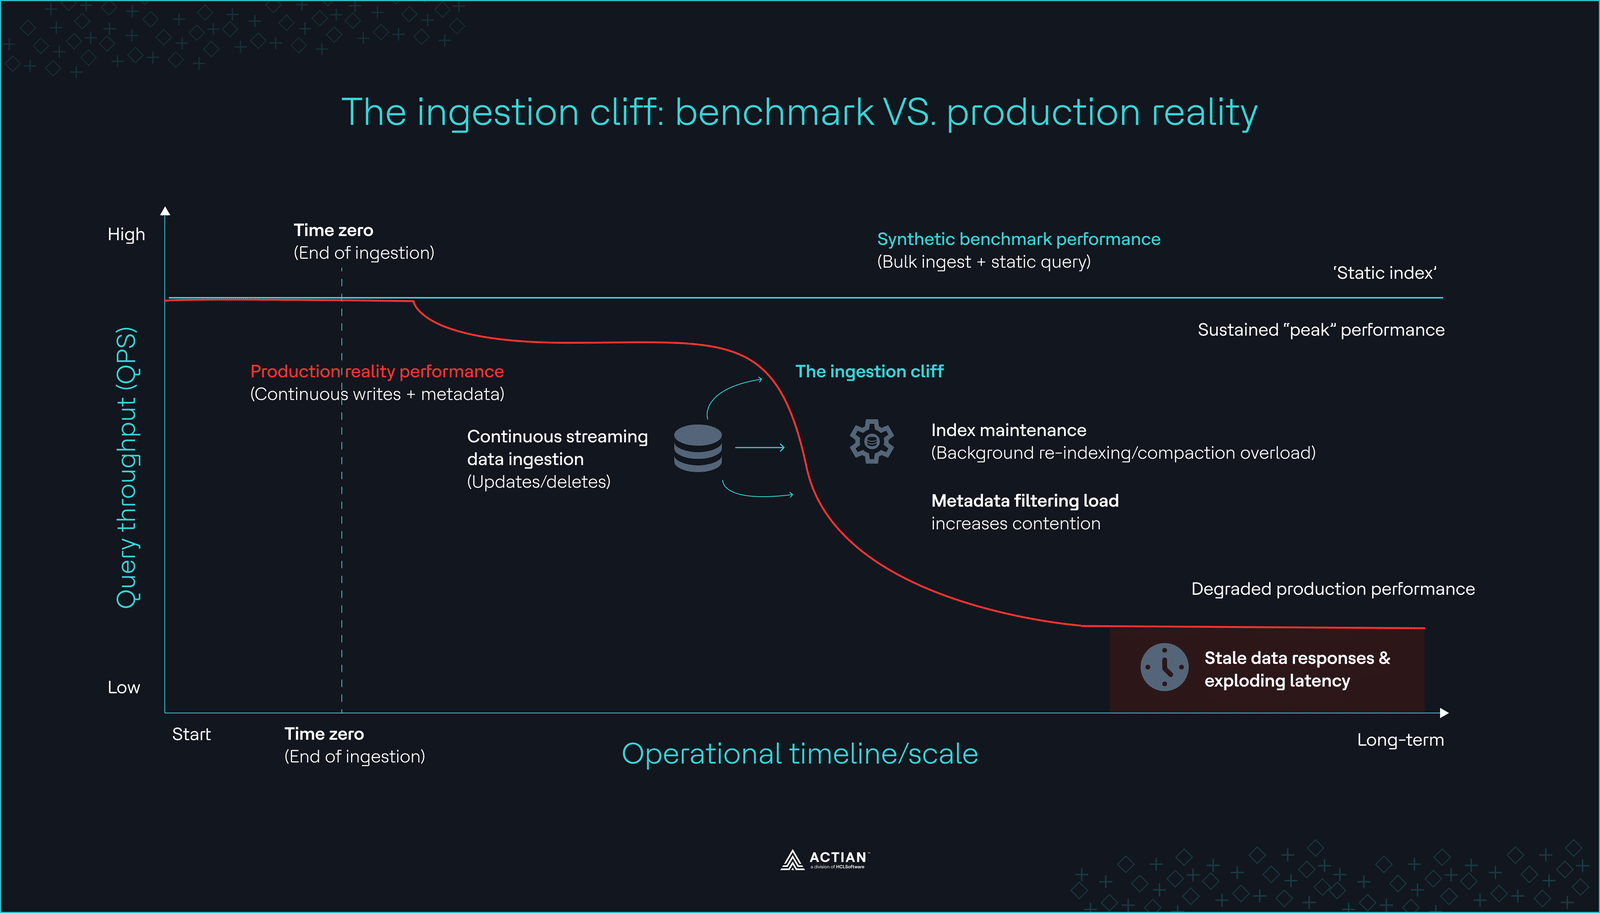 The ingestion cliff
Spotting these hidden bottlenecks is the first step to building a strong system. In 2026, the answer is rarely to use a faster, specialized database. Instead, engineers are adding these features to the tools they already know and trust.
The Consolidation Shift: Vector as a Feature
Corey Quinn, Chief Cloud Economist, once said: “Vector is a feature, not a product.” This prediction shapes the 2026 market. Teams are moving away from specialized “Vector-Only” databases and choosing integrated “Vector-Also” platforms. Shifting data between a main database and a separate vector database often causes more problems than it fixes.
The PostgreSQL renaissance
Engineers frequently argue on platforms like Hacker News that ~80% of RAG use cases (specifically those with embeddings under 2M) do not require a specialized vector database. For these workloads, standalone silos often introduce more operational friction than they offer in performance gains. Instacart validated this at scale by migrating from Elasticsearch to PostgreSQL, achieving 80% cost savings and reducing write workload by 10x after eliminating the need to coordinate and reconcile data across fragmented architectures.
Recently, pgvectorscale achieved 471 queries per second at 99% recall on 50 million vectors, outperforming Qdrant’s 41 QPS on identical AWS hardware. Vendor benchmarks often omit this result because it shows that most RAG applications don’t require a specialized vendor.
| Performance metric | PostgreSQL (pgvector + pgvectorscale) | Qdrant (Specialized) | The Delta |
|---|---|---|---|
| Throughput (QPS) | 471.57 | 41.47 | 11.4x higher in Postgres |
| P95 Latency | 60.42 ms | 36.73 ms | Qdrant is 39% faster at tail |
| P99 Latency | 74.60 ms | 38.71 ms | Qdrant is 48% faster at tail |
| Hardware | AWS r6id.4xlarge (16 vCPU) | AWS r6id.4xlarge (16 vCPU) | Parity |
The integrated enterprise gap
For workloads that exceed basic extensions, Actian VectorAI DB bridges the gap by embedding a high-performance engine with native vector support. Teams can execute metadata filtering and similarity search within a single system, reducing data movement and simplifying query execution.
| Platform | Architectural strategy | Intended AI capability |
|---|---|---|
| Actian VectorAI DB | High-performance hybrid | Engineered for integrated analytics + native vector support. |
| PostgreSQL | Integrated feature | Leverages pgvector within standard SQL. |
| AWS S3 Vectors | Storage-centric | Designed to query multi-billion vectors in object storage. |
| MongoDB Atlas | Unified document/vector API | Integrates native vector search directly into the existing document store workflow. |
As the market comes together, the way we evaluate databases shifts. Teams no longer ask, “Who has the fastest graph?” They ask, “Which architecture provides the most reliable query engine?” No universal winner exists. Teams instead face a spectrum of trade-offs between specialized speed and integrated reliability.
The evaluation process now puts more weight on operational strength, real-world flexibility, and support for hybrid search. Reliable query execution is becoming the top priority, especially given the growing demand for hybrid search.
Hybrid Search Reality That Pure Vector Benchmarks Hide
Pure vector search often fails the “groundedness” test, which measures how strictly an AI’s response relies on provided source material. A high groundedness score ensures that the LLM avoids fabrication and adheres closely to your internal data.
According to an analysis by the Microsoft Azure DevBlog, pure vector search alone struggles with factual accuracy, scoring a mediocre 2.79 out of 5 for groundedness. The solution is Hybrid Search, which blends semantic vector similarity with traditional keyword matching (BM25).
The 20–40% performance penalty
Hybrid search demands significant computation. The database must rank results from two different engines, such as lexical and semantic, then merge them using a fusion algorithm. Production implementations typically see a 20–40% performance penalty when moving from pure vector search to hybrid search. Reciprocal Rank Fusion (RRF) creates most of this “merge tax”, which, according to Elastic’s research, can significantly increase query latency compared to single-index lookups.
Databases that integrate vector search with filtering, full-text search, and query execution in a single engine execute hybrid queries within a single atomic statement. The query optimizer can evaluate metadata filters, full-text conditions, and vector similarity at once. This lets the optimizer produce better execution plans and move less data.
In contrast, specialized vector silos fragment the query path. Applications route requests across multiple systems and merge results outside the database. This increases system complexity and introduces unpredictable latency under load.
Hybrid platforms such as Actian VectorAI DB address this problem by embedding vector search within the database engine. This design removes cross-system joins, simplifies operations, and reduces long-term architectural overhead.
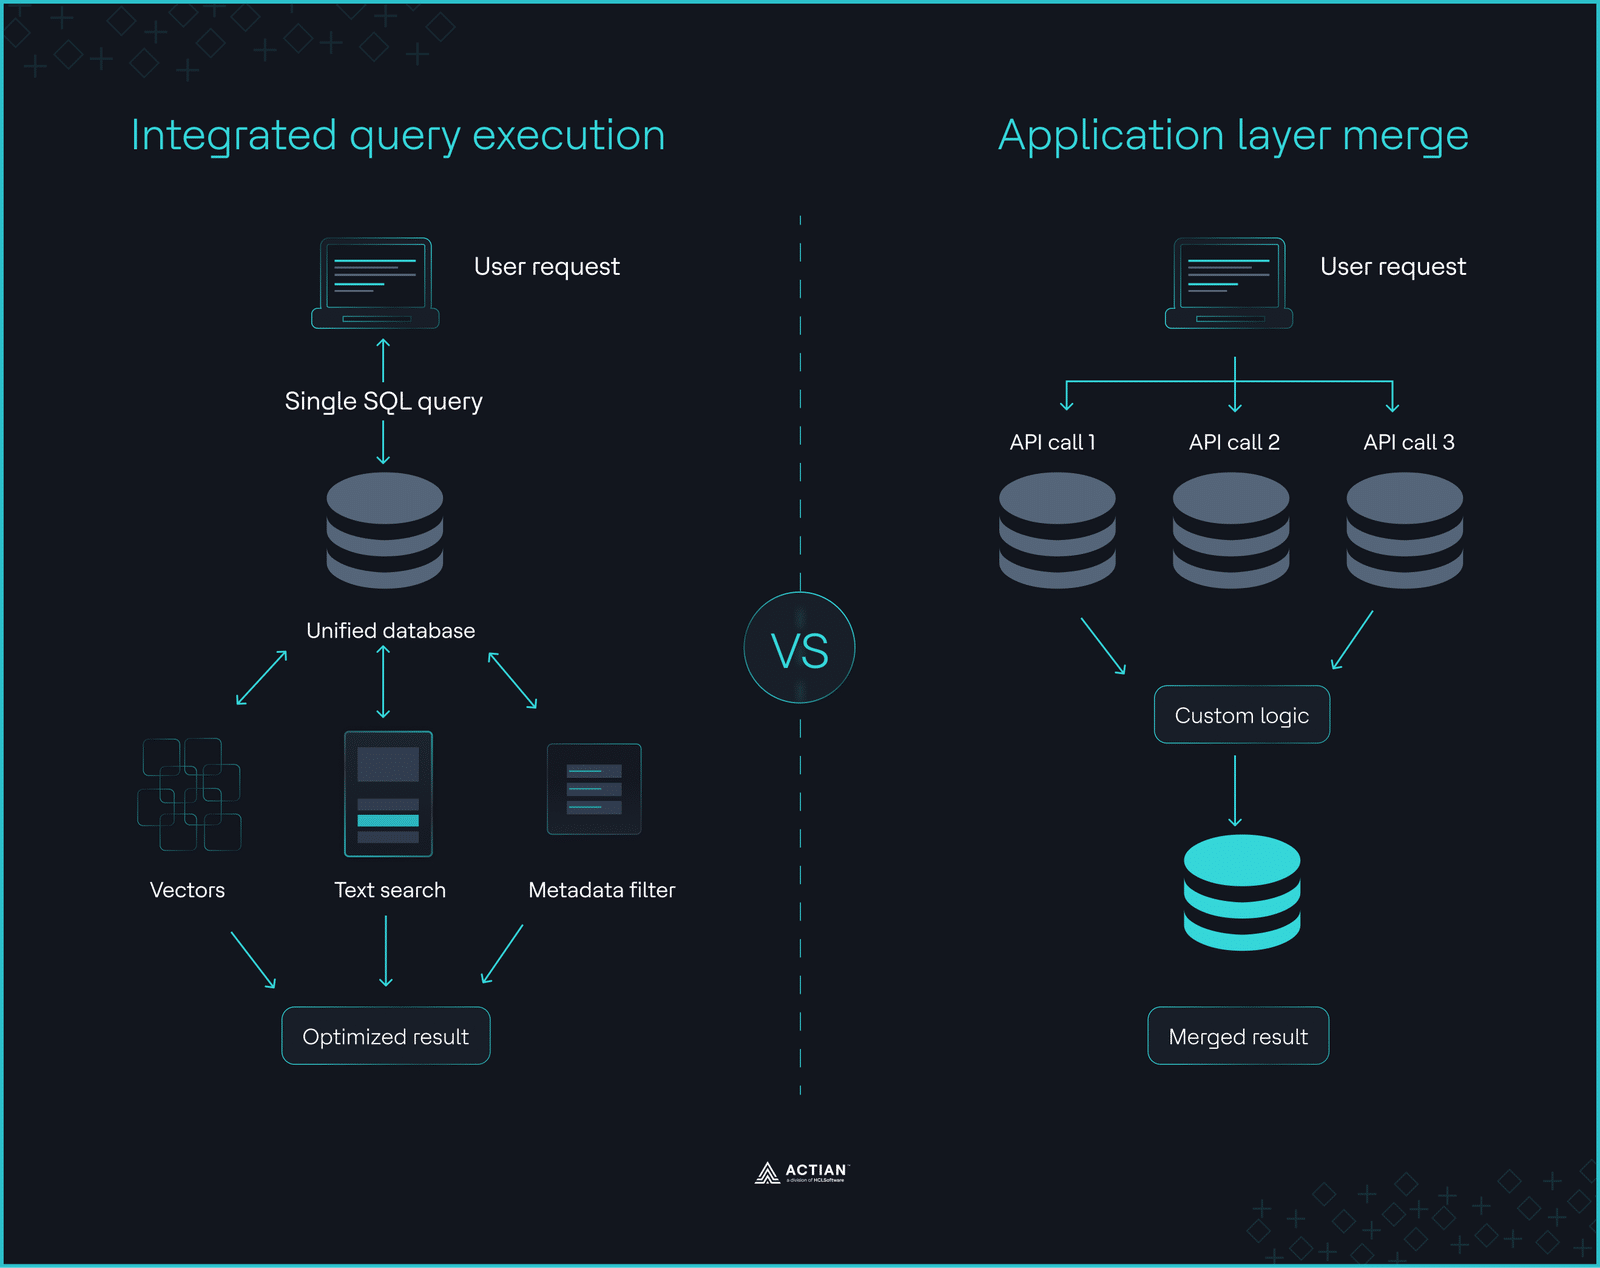 Integrated query execution vs. application layer merge
Build Your Own Evaluation Framework
Stop asking which database won a GitHub leaderboard. Start asking which architecture survives your constraints. In 2026, these constraints center on data residency, scale, and team expertise.
The case for hybrid and on-premises
Data residency is no longer optional for global companies. With EU AI Act penalties reaching 35M Euros or 7% of global revenue, cloud-only vector databases represent a legal non-starter for regulated industries.
- Sovereignty: 60% of financial firms outside the US plan to adopt sovereign/on-premises vector solutions by 2028.
- Cost: As query volumes hit 100M/month, the “cloud tax” becomes visible. Self-hosting or using hybrid platforms like Actian can cut your infrastructure bill in half.
- Maturity: If you already manage a relational database, your team possesses 90% of the required skills.
The 2026 architecture decision tree
- Does the data require on-premises storage for compliance? → Prioritize Actian VectorAI DB or self-hosted PostgreSQL.
- Does your query volume exceed 100M/month? → Avoid managed usage-based pricing; use self-hosted or reserved capacity.
- Do you require complex metadata filtering? → An integrated relational/vector engine is non-negotiable.
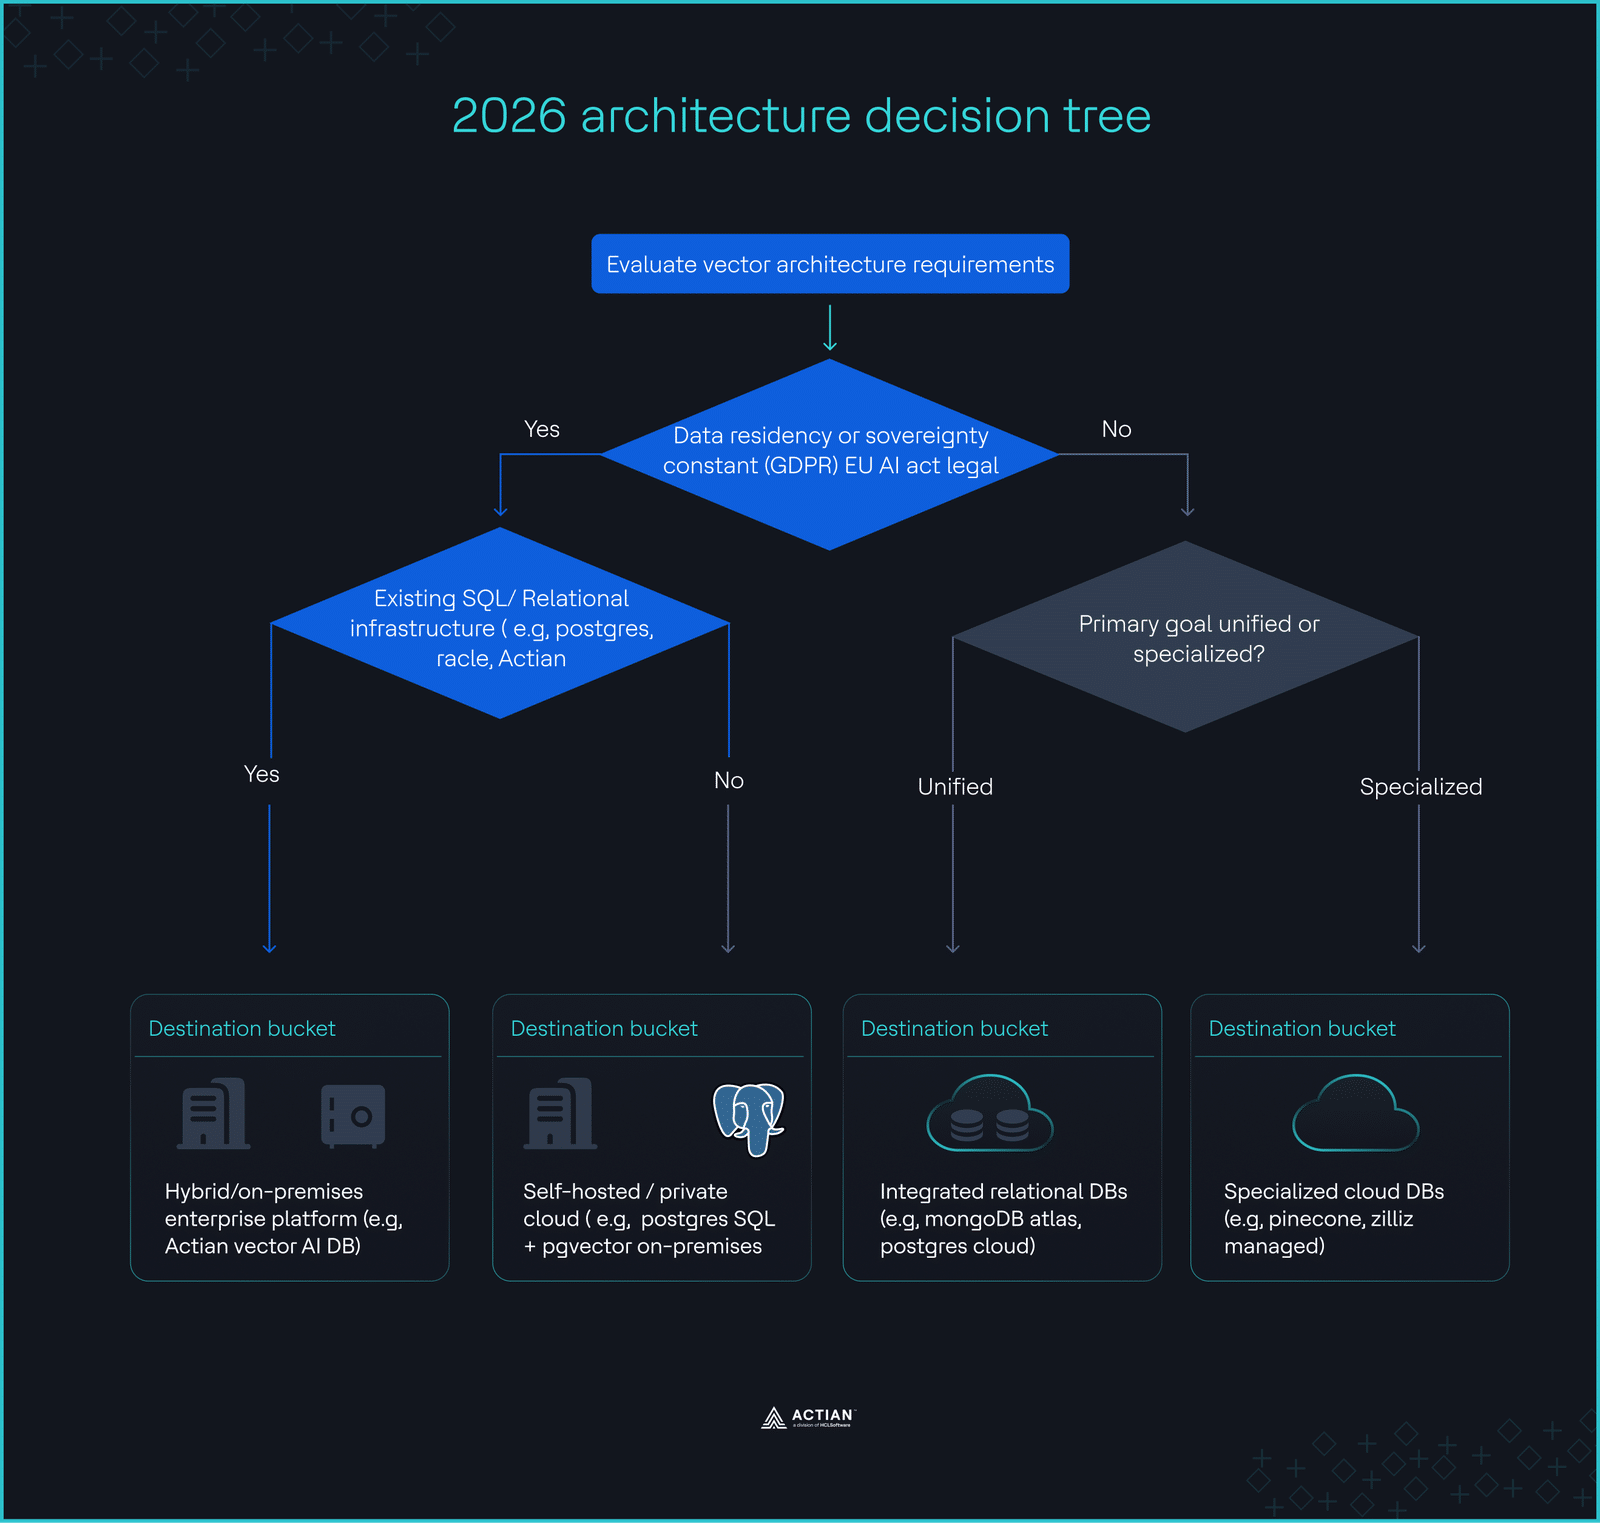 The 2026 architecture decision tree
How to Evaluate the Evaluators
To avoid letting vendor benchmarks mislead you, give the evaluation tool the same careful review you give the database. To spot a biased test, look past the headline QPS numbers and check the exact conditions that produced them.
Use the following evaluation rubric to review any benchmark report before it shapes your architectural decisions.
| Evaluation metric | Red flag (Discard result) | Green flag (Trustworthy result) |
|---|---|---|
| Ingestion state | Queries run against a static, immutable index with zero background writes. | “Read-while-Write” testing, where queries run during continuous data ingestion. |
| Hardware parity | Vendor cloud “Optimized” vs. Competitor “Default” local/mismatched instances. | Verified identical CPU, RAM, and Disk I/O configurations across all tested systems. |
| Data selectivity | “High Selectivity” filters (99% of data removed) that hide join/scan inefficiencies. | “Low Selectivity” (10–20% filtered) tests that force the engine to handle large-scale index traversal. |
| Dimensionality | Testing on 128-dimension legacy datasets (SIFT/GIST). | Testing on 1,536 or 3,072-dimension vectors that match modern LLM outputs. |
| Latency metric | Focuses strictly on “Average Latency” or “Mean Response Time.” | Clearly publishes P95 and P99 tail latency under high concurrent load. |
Pre-Commitment Checklist
- Test with production-representative high-dimensional embeddings (3,072d+).
- Measure P99 latency with 100+ concurrent users hitting diverse metadata filters.
- Calculate 3-year TCO, including storage growth, egress, and re-indexing fees.
- Confirm that your team can manage observability and backups for the new stack.
Final Thoughts
Real evaluation requires testing with your data, your patterns, and your scale. Load your production-representative data, run a week-long stability test under concurrent load, and measure P99 latency and the TCO.
If your workload requires compliance, hybrid deployment, or production-grade operational maturity that managed vector databases don’t offer, then Actian VectorAI DB early access is the right next step.
Join the Actian community on Discord to discuss vector architecture with engineers solving real production problems.

Stay connected
Data insights delivered to you.
(i.e. sales@..., support@...)