Data Intelligence

Data Literacy: The Foundation for Effective Data Governance

Actian Corporation

November 2, 2021

On September 28th and 29th, we attended several conferences during the Big Data & AI Paris 2021. One of these conferences particularly caught our attention around a very trendy topic: data literacy. In this article, we will present best practices for implementing data literacy that Jennifer Belissent, Analyst at Forrester and Data Analyst at Snowflake, shared during her presentation. She also detailed why this practice is essential for effective data governance.

The Data-Driven Enterprise

It’s no secret that today, all companies want to become data-driven. And everyone is looking for data. Indeed, it is no longer reserved for a particular person or team but for all departments of the organization. From reporting to predictive analytics to the implementation of machine learning algorithms, data must be present in the company’s applications and processes to provide information directly for the organization’s strategic decision-making. 

To do this, Jennifer says: “Silos must be broken down throughout the company! We need to give access to internal data, of course, but we must not neglect external data, such as data from suppliers, customers, and partners. We use it, and today we are even dependent on it.”

What is Data Literacy?

Data literacy is the ability to identify, collect, process, analyze, and interpret data to understand the transformations, processes, and behaviors it generates. 

However, many employees suffer from a lack of knowledge around data and associated analytics because they do not recognize what data is and the value it brings to the company. And every employee has a role to play. For better data governance, a data literacy program must be established. 

The Challenges of Data Governance

The colossal amounts of data an organization generates must be managed and governed properly in order to extract a maximum value from them. Jennifer presents the three major challenges at Snowflake:

  1. Data is Everywhere: Whether it’s in analytics systems, storage locations, or Excel files, it’s hard to know all the data in the company if it’s not shared.
  2. Data Management is Complex: It’s hard to manage all this data from various sources. Where is the data? What does it contain? Who owns it? The answers to these questions require centralized visibility and control.
  3. Security and Governance are Rigid: Data security is very often linked to the organization’s data silos. To secure and govern this data, it is necessary to have a unified, consistent and flexible policy.

But that’s not all! There is a fourth challenge: the lack of data literacy.

The Consequences of a Lack of Data Literacy in an Organization

To illustrate what data literacy is, Jennifer recounts to us an anecdote. In early 2020, during the first lockdown in France, Jennifer was talking to the Chief Data Officer at Sodexo. The CDO told Jennifer that during a data analysis related to their website, an interesting fact emerged: a peak in the purchase of sausages in the morning.

This surprised the CDO who found this increase in sausage sales strange, knowing that “breakfast sausages” were not a usual breakfast for the French.

Upon further investigation, the CDO discovered that this spike in sales coincided with Sodexo’s replacement of traditional point-of-sale cash registers with automated kiosks. These kiosks had buttons for each item to better manage orders. The problem was identified: the cashier in charge of these new kiosks had no idea what these buttons represented and was constantly pressing them, without knowing that they were actually capturing data! Fortunately, Sodexo had noticed this, otherwise the company would have ordered a huge stock of sausages…

Following this story, Jennifer says she conducted a qualitative study with Forrester asking three questions:

1. Do you work with data?
2. Are you comfortable with data?
3. If not, what training would help you feel more comfortable with data?

The answers to these questions were surprising! In fact, Jennifer says Forrester thought the most important question in the study would be the last one. But it was actually the answers to the first question that surprised them: many of the people answered that they didn’t work with data at all because “they didn’t work with spreadsheets or calculations.

On the other hand, those who answered that they were comfortable with data had a big lack of trust with their colleagues: these people were the only ones who understood the data and therefore worried about the mistakes their collaborators might make.

“So there were two major problems with data: getting useful and reliable data, but more importantly, most people in this study didn’t even know they were working with data!” says Jennifer. 

Lack of Data Literacy Undermines Data Governance

The definition of data literacy, according to Jennifer, is someone who can read, understand, create and communicate data. But Jennifer doesn’t think that’s enough: “You also have to be able to recognize data. As we’ve seen, many people today don’t know what data is.”

For many, data governance is only associated with security. But in reality, governance spans the entire value chain and the entire life cycle of data. There are three pillars of data governance according to Jennifer:

  1. Know the Data: Understand, classify, track data and its use, know who owns it, know if it’s good quality, if it’s sensitive, etc.
  2. Protect Data: Secure sensitive data with access controls based on internal policies and external regulations.
  3. Liberate Data: Convey the potential of data and enable teams to share it.

And around these three pillars comes data literacy. Data governance will be improved through better data literacy.

Best Practices in Data Literacy

The implementation of a data literacy program should not be reserved to experts, and should even start at the bottom of the pyramid. This starts with the onboarding process of a new employee, for example.

Jennifer suggests that companies wishing to become data-driven rely on a data literacy program that meets 4 objectives:

  • Raise Awareness: Make all employees aware of what data is, its interest, the role of each person with regard to data and, above all, the value it brings to the company.
  • Improve Understanding: Those who are supposed to use data in the company are often afraid, and do not always understand it. It is therefore important to provide them with the right tools, help them ask the right questions and explain the logic of the analyses so that these users can make better decisions.
  • Enriching Expertise: This means putting the best technical tools and practices in place, but it also means leveraging them.
  • Enable Scaling: It is thanks to your company’s data experts that you will be able to enable scaling and therefore, help create a community and a data culture. It is important that these experts pass on their knowledge to the whole company.

To conclude, Jennifer shares one last analogy:

“For data-driven companies, data governance represents the traffic laws, and data literacy is the foundation.” 

actian avatar logo

About Actian Corporation

Actian empowers enterprises to confidently manage and govern data at scale. Actian data intelligence solutions help streamline complex data environments and accelerate the delivery of AI-ready data. Designed to be flexible, Actian solutions integrate seamlessly and perform reliably across on-premises, cloud, and hybrid environments. Learn more about Actian, the data division of HCLSoftware, at actian.com.
Data Intelligence

Breaking Down Data Lineage: Typologies and Granularity

Actian Corporation

November 2, 2021

data-lineage-decomposed-article-zeenea

As a concept, Data Lineage seems universal: whatever the sector of activity, any stakeholder in a data-driven organization needs to know the origin (upstream lineage) and the destination (downstream lineage) of the data they are handling or interpreting. This need has important underlying motives.

For a Data Catalog vendor, the ability to manage Data Lineage is crucial to its offer. As is often the case, however, behind a simple and universal question lies a world of complexity that is difficult to grasp. This complexity is partially linked to the heterogeneity of answers that vary from one interlocutor to another in the company.

In this article, we will explain our approach to breaking down data lineage according to the nature of the information sought and its granularity.

The Typology of Data Lineage: Seeking the Origin of Data

There are many possible answers as to the origin of any given data. Some will want to know the exact formula or semantics of the data. Others will want to know from which system(s), application(s), machine(s), or factory it comes from. Some will be interested in the business or operational processes that produced the data. Some will be interested in the entire upstream and downstream technical processing chain. It’s difficult to sort through this maze of considerations!

A Layer Approach

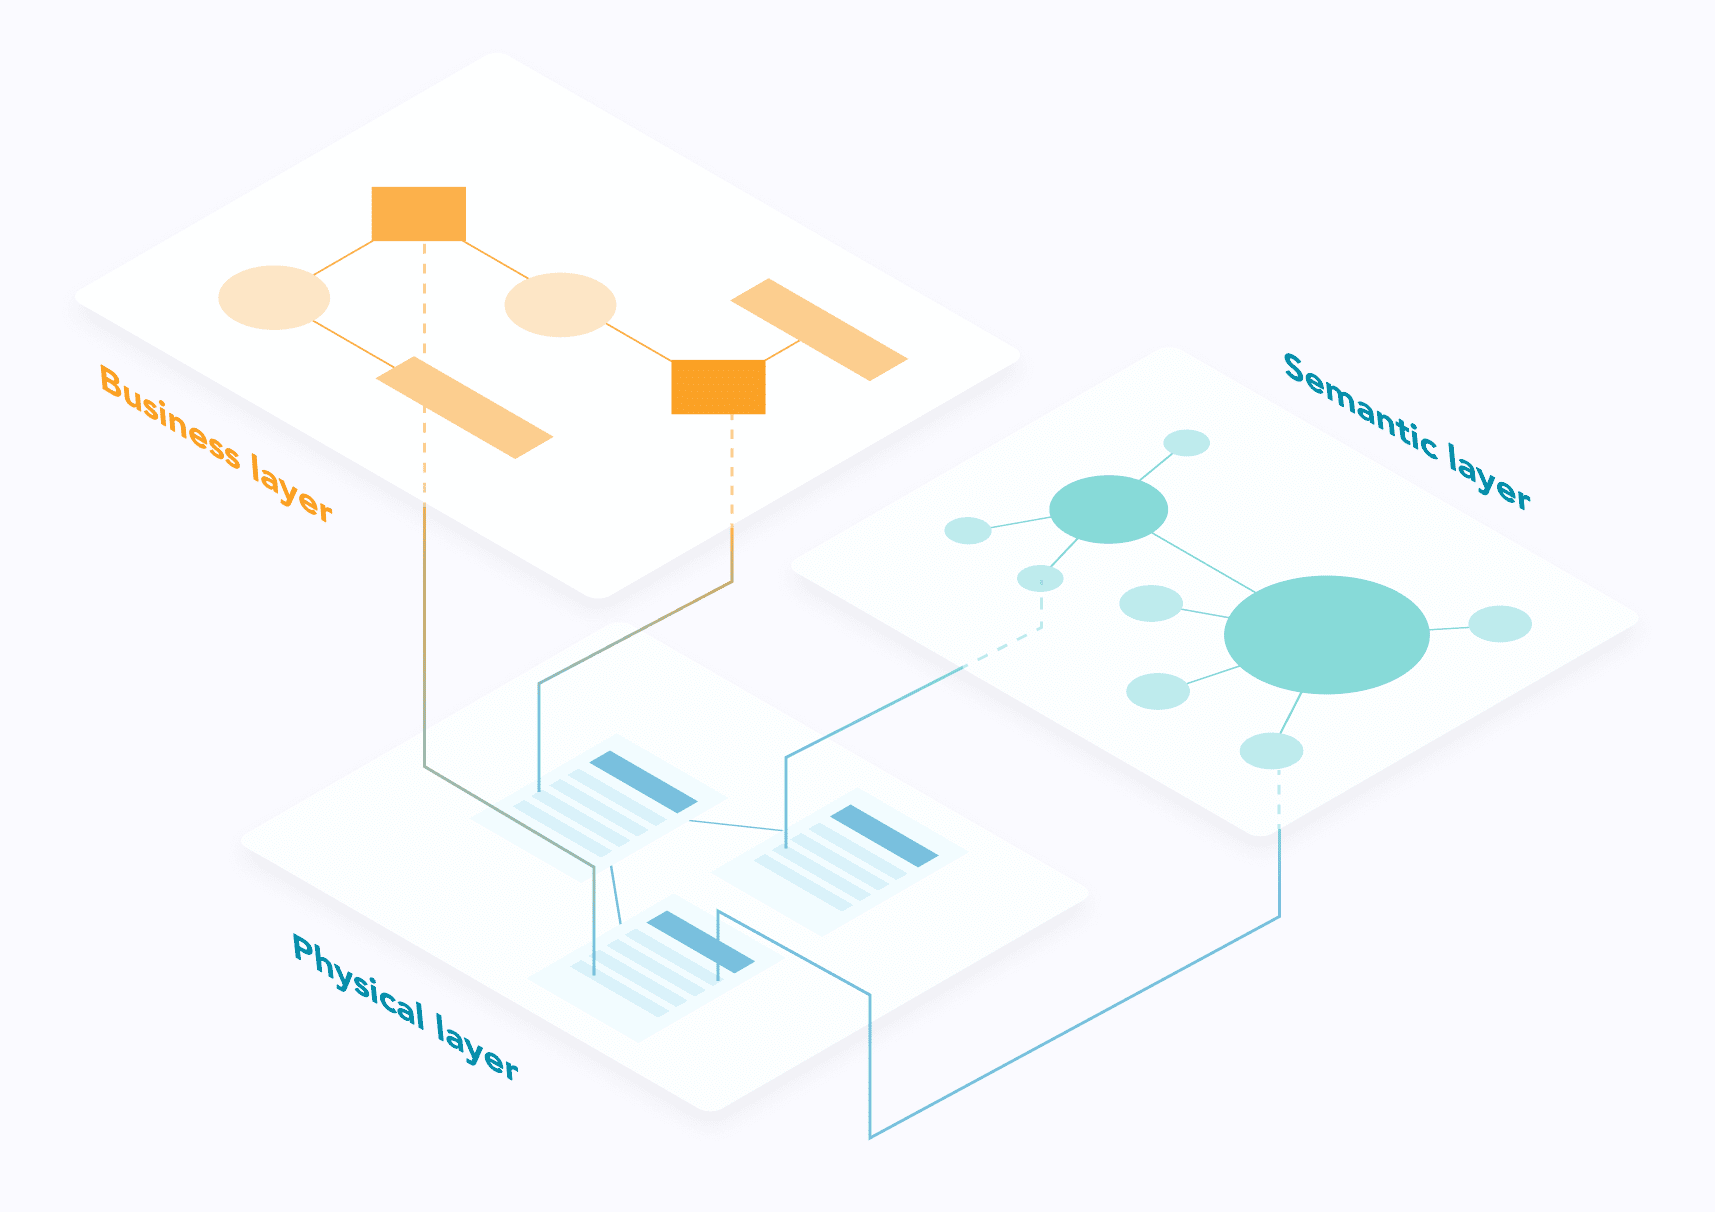
To structure lineage information, we suggest emulating what is practiced in the field of geo-mapping by distinguishing several superimposable layers. We can identify three:

  • The physical layer, which includes the objects of the information system – applications, systems, databases, data sets, integration or transformation programs, etc.
  • The business layer, which contains the organizational elements – domains, business processes or activities, entities, managers, controls, committees, etc.
  • The semantic layer, which deals with the meaning of the data – calculation formulas, definitions, ontologies, etc.

A Focus on the Physical Layer

The physical layer is the basic canvas on which all the other layers can be anchored. This approach is again similar to what is practiced in geo-mapping: above the physical map, it is possible to superimpose other layers carrying specific information.

The physical layer represents the technical dimension of the lineage; it is materialized by tangible technical artifacts – databases, file systems, integration middleware, BI tools, scripts and programs, etc. In theory, the structure of the physical lineage can be extracted from these systems, and then largely automated, which is not generally the case for the other layers.

The following seems fundamental: for this bottom-up approach to work, it is necessary that the physical lineage be complete.

This does not mean that the lineage of all physical objects must be available, but for the objects that do have lineage, this lineage must be complete. There are two reasons for this. The first reason is that a partial (and therefore false) lineage risks misleading the person who consults it, jeopardizing the adoption of the catalog. Secondly, the physical layer serves as an anchor for the other layers which means any shortcomings in its lineage will be propagated.

In addition to this layer-by-layer representation, let’s address another fundamental aspect of lineage: its granularity.

Granularity in Data Lineage

When it comes to lineage granularity, we identify 4 distinct levels: values, fields (or columns), datasets and applications.

The values can be addressed quickly. Their purpose is to track all the steps taken to calculate any particular data (we’re referring to specific values, not the definition of any specific data). For mark-to-model pricing applications, for example, the price lineage must include all raw data (timestamp, vendor, value), the values derived from this raw data as well as the versions of all algorithms used in the calculation.

Regulatory requirements exist in many fields (banking, finance, insurance, healthcare, pharmaceutical, IOT, etc.), but usually in a very localized way. They are clearly out of the reach of a data catalog, in which it is difficult to imagine managing every data value! Meeting these requirements calls for either a specialized software package or a specific development.

The other three levels deal with metadata, and are clearly in the remit of a data catalog. Let’s detail them quickly.

The field level is the most detailed level. It consists of tracing all the steps (at the physical, business or semantic level) for an item of information in a dataset (table or file), a report, a dashboard, etc., that enable the field in question to be populated.

At the dataset level, the lineage is no longer defined for each field but at the level of the field container, which can be a table in a database, a file in a data lake, an API, etc. On this level, the steps that allow us to populate the dataset as a whole are represented, typically from other datasets (we also find on this level other artifacts such as reports, dashboards, ML models or even algorithms).

Finally, the application level enables the documentation of the lineage macroscopically, focusing on high-level logical elements in the information system. The term “application” is used here in a generic way to designate a functional grouping of several datasets.

It is of course possible to imagine other levels beyond those 3 (grouping applications into business domains, for example), but increasing the complexity is more a matter of flow mapping than lineage.

Finally, it is important to keep in mind that each level is intertwined with the level above it. This means the lineage from the higher level can be worked out from the lineage of the lower level (if I know the lineage of all the fields of a dataset, then I can infer the line age of this dataset).

We hope that this breakdown of data lineage will help you better understand it for your organization. In a future article, we will share our approach so that each business can derive maximum value from Lineage thanks to our typology/granularity/business matrix. 

actian avatar logo

About Actian Corporation

Actian empowers enterprises to confidently manage and govern data at scale. Actian data intelligence solutions help streamline complex data environments and accelerate the delivery of AI-ready data. Designed to be flexible, Actian solutions integrate seamlessly and perform reliably across on-premises, cloud, and hybrid environments. Learn more about Actian, the data division of HCLSoftware, at actian.com.
Data Intelligence

What if You Were to Embark on the Path of Data Intelligence?

Actian Corporation

November 2, 2021

data-intelligence-blog-post-zeenea.

Better understand your data for it to be used more quickly and efficiently: this is the promise of this discipline, which is called Data Intelligence. Too often confused with Business Intelligence, it is the foundation of your Data strategy.

Data Intelligence, Data mining, Data Science, Data storytelling, Data visualization…there are so many disciplines related to the use of data and so many different terms that confuses the majority of people. This is the case with Data Intelligence, as it is often confused with Business Intelligence

However, these concepts are very different in their methodologies as well as in their very functions. The main vector of confusion comes from the term Intelligence. No, Data Intelligence is not about making your data intelligent, but about informing you about the very nature of your data.

The word Intelligence should be understood in the sense of Inform. Data Intelligence refers to all the analysis tools and methods available to your company to better understand the information collected and improve services or products.

Business Intelligence, on the other hand, focuses on the organization of data and its presentation to facilitate its understanding and to draw knowledge from it. As a result, Data Intelligence is more concerned with the analysis of the information itself than with how you can derive operational insights or feed strategic thinking.

What are the Main Benefits of Data Intelligence?

The problem for companies no longer concerns producing data but exploiting it efficiently. According to a study conducted by IDC, entitled Deployment and Data Intelligence in 2019, nearly 7 out of 10 employees (67%) waste time searching for and preparing data.

Data Intelligence is one of the pillars for better efficiency in data exploitation. By engaging in a Data Intelligence project, you will be able to better know your data and better understand it, to reveal its quintessence. The objective: to carry out, through adapted solutions, an in-depth exploration of your data and identify the essential information. In other words, the very principle of Data Intelligence is the refinement of raw data.

In this sense, this discipline constitutes one of the foundations of your company’s transformation into a data-centric dimension. Data Intelligence applies to the data you collect on your own, but it can also be used to work on external data sources.

In all cases, Data Intelligence has one ambition: to rely on the knowledge of an identified reality in order to carry out rigorous analysis of operations, financial or human resources to be deployed in the future. Data Intelligence is thus perfectly adapted when it comes to preparing investments, for example. The larger the amount of data you collect and use, the more you will benefit from using data intelligence.

Last but not least, Data Intelligence is a prerequisite for compliance. Indeed, according to the GDPR, you must be able to identify data considered as sensitive. And Data Intelligence allows just that.

Why Switch to Data Intelligence?

As mentioned, Data Intelligence is intended to inform you about your data itself in order to better know how to exploit it. Therefore, the first step is to perform a complete review of the available data portfolio using, if necessary, a data discovery tool or solution. Once this preliminary step has been completed, you can, for example, perform geographic reconciliations.

You want to open a new point of sale? With Data Intelligence, you will be able to identify the geographical areas that are most suitable for your project, based on your data on your customers, suppliers and even your competitors.

Efficiency, relevance, reactivity, the three pillars on which you can rely with Data Intelligence.

actian avatar logo

About Actian Corporation

Actian empowers enterprises to confidently manage and govern data at scale. Actian data intelligence solutions help streamline complex data environments and accelerate the delivery of AI-ready data. Designed to be flexible, Actian solutions integrate seamlessly and perform reliably across on-premises, cloud, and hybrid environments. Learn more about Actian, the data division of HCLSoftware, at actian.com.
Healthcare

Healthcare Data Warehouse

Actian Corporation

November 1, 2021

Healthcare Data Warehouse

A data warehouse is a centralized repository for the storage of data from one or more aggregated sources, updated immediately with real-time data yet retaining prior data for a more comprehensive dataset. The data in the data warehouse can be different types of data in various formats for disparate sources such as electronic health records and other clinical data and operational and administrative records – all can be in other formats and come from multiple sources of technologies and people.  A Healthcare data warehouse often depends on integration tools to support extraction, transformation and loading (ETL) from proprietary healthcare systems such as EPIC, Cerner, and many others. 

Healthcare Data Warehouse

Healthcare data can be used for analytics often categorized into three significant areas which are descriptive, predictive, and prescriptive analytics. This data can be used by many different experts in the healthcare field, ranging from clinicians to healthcare provider administrators and those on the Payer side (claims adjusters, underwriters, provider network managers, and so forth).

Examples of sources of healthcare data:

  • Medical records, inpatient, outpatient.
  • Vital records such as claims.
  • Financial records such as reimbursements.
  • Disease and cause of mortality registries and other Population Health records such as HEDIS.
  • Administrative records.
  • Prescriptions.
  • Laboratory test.
  • Monitoring.
  • Social determinants of health (SDOH).

Within a healthcare data warehouse, descriptive analytics or trend analysis can be done for a patient to determine what has happened to them over a period of time. This data then can be anonymized and aggregated over larger populations and then used for predictive and prescriptive analysis to prescribe solutions for the individual patient or to understand how medical solutions support people in general. Payers can use healthcare data to determine what rates to set for group policies and individuals as customers and what reimbursement schedules to set for in-network and out-of-network providers.

There are many healthcare data model examples that can be established using data from a healthcare data warehouse. There can be many healthcare consumers of the same data for different purposes. The value of common shared data from various sources to solve different problems cannot be underestimated using healthcare data warehouse analytics. Such as those used by drug manufacturers for new and existing drugs usage in society. Or combining data from hospital intake and release records, bed management systems, and EHR records to reduce the length of hospital stays without increasing hospital-acquired infection rates is critical to retaining favorable reimbursement rates from Medicaid and Medicare.

Besides, the service and technology providers such as drug manufacturers, payers, and providers can benefit from an enterprise healthcare data warehouse, especially with challenges such as managing cost, risk, patient experience, and overall delivering better outcomes. Payers need insights to facilitate the shift to value-based care and support payment integrity.  Improved payer-provider alignment is now possible with data interoperability mandates between payers and provider systems. This creates an abundance of data to mine for actionable insights and decisions. Data must be extracted, transformed, and loaded (ETL) into a data warehouse and possibly into an Enterprise Data Hub for easy usage by payers and providers.

Statistical data from various populations of people or individuals can lead to research advancements, cures, improved preventive measures, and the overall health of the world’s population. Payers and providers can use data in an enterprise warehouse to deliver better-valued care while at the same time reducing cost and improving the economic value of the service offered to all.

Benefits of Healthcare Data Warehouse

The clinical use of an enterprise data warehouse cannot be underestimated. Besides the expertise of people in various medical fields, clinical data from healthcare data warehouses can be invaluable in helping with the analysis of tons of healthcare data.

The benefits of a healthcare data warehouse all begin with how the technology is used. How models are created and data is processed. Information technology, including the integration of medical devices and instrumentation into the IoT, big data, data warehouses, and other innovations, have improved the ability of all organizations, especially in healthcare, to become more efficient and effective in delivering outcomes. The ease of use of these data warehouse solutions has made them more valuable than ever in our society.

Data and information are the most efficient and effective ways of communication and creating coordination and collaboration for successful outcomes between people of different expertise and backgrounds. Many healthcare specialists can look at the same data and information and create collaborative solutions based on the expertise of each for a patient or society as a whole. Without the data, healthcare becomes very opinionated, which can lead to less collaboration between experts for the person’s benefit and reactionary non-scientific prescriptions and medical procedures and protocols during emergency scenarios such as the Covid-19 pandemic.

Now with a healthcare data warehouse and the ability to use integrated collaborative data across payers, providers, members, and patients, the business of healthcare becomes more transparent while at the same time adhering to HIPAA compliance. This allows a shift from fee-for-service to a more coordinated and collaborative value-based system focused on outcomes.

The Actian Healthcare Data Analytics Hub is powered by the Actian data warehouse, enables payers, providers, and others in the healthcare ecosystem to gain greater insights and drive better outcomes with data and enables an organization to shift from siloed models of business and operations to models that are forward-looking and collaborative.

actian avatar logo

About Actian Corporation

Actian empowers enterprises to confidently manage and govern data at scale. Actian data intelligence solutions help streamline complex data environments and accelerate the delivery of AI-ready data. Designed to be flexible, Actian solutions integrate seamlessly and perform reliably across on-premises, cloud, and hybrid environments. Learn more about Actian, the data division of HCLSoftware, at actian.com.
Data Analytics

Affinity Analytics Using Actian Data Platform

Mary Schulte

October 29, 2021

affinity analytics

Affinity analytics is the practice of finding relationships and patterns in data. Businesses can use the results from affinity analytics for many positive impacts.   Here are just two examples from real customer use cases. First, in retail, management wants to know what products typically sell well together for product placement and advertising purposes. This information is critical to successfully upselling additional products. Another example, telecommunications providers need to study network traffic data to understand routing patterns and maximize equipment and topography. Like these use cases, your business likely has occurrences of data affinity that you can harness to make better business decisions. Actian provides the data warehouse platform to help you do it.

Despite being clearly useful, affinity is difficult to find in traditional data warehouses because it involves executing one of the most difficult, resource-intensive SQL statements known, the fact-table self-join (also known as a “market-basket” query). This query is difficult because data warehouse “fact” tables often contain billions of rows (like mine does here), and joining billions of rows back to themselves to find affinity takes a lot of processing power. In fact, some platforms can’t do it at all, or it takes so long it’s not usable. That is where the power of the Actian Data Warehouse shines.

In this blog, I discuss how to successfully achieve affinity analytics using solely the built-in functionality of the Actian Data Warehouse, with no other tooling required!

Actian provides industry-leading cloud analytics, purpose-built for high performance.  What I will show here is that Actian – natively – provides the necessary tooling to accomplish SQL analytics, allowing you can achieve things like affinity analytics without having to embark on giant, expensive projects involving additional third-party tooling.

Here is my Scenario:

I have a retail data warehouse. Marketing wants to plan an outreach mail campaign to promote sales of products that typically sell well with the store’s best-selling products. In particular, they want to mail coupons to customers that have NOT bought products that are normally bought together, but HAVE purchased at least one of the best-selling products. They would like me to provide data to support this campaign.

My Analytics Process Will be as Follows:

  1. Investigate the data.
  2. Find best-selling products (A).
  3. Find products commonly sold with top products (B).
  4. Find the customer population who bought A but not B.
  5. Provide appropriate information to marketing.

For this blog, I have created an 8 AU (Actian Unit) warehouse in the Google Cloud Platform.  An Actian Unit is measure of cloud computing power that can be scaled up or down.

My Actian database has a typical retail schema, but for this blog, I will just focus on four tables.  See Figure 2.

Figure 2: Retail ER diagram

I have used a data generator to generate a large amount of data, but I’ve added some artificially superimposed patterns to make this blog more interesting. My tables have the following number of rows in them:

customer 5,182,631
order 1,421,706,929
lineitem 45,622,951,425
product 16,424


I can now use the tools provided in the Actian console Query Editor to execute my analytics process. You can find the Query Editor in the top right corner of the warehouse definition page. I have circled it in blue in Figure 1.

For all the queries in this blog, I performed the following sequence: I put my query into the query editor pane (1), formatted the query (optional) (2), then executed the query (3), then saved the query (4) for future reference. See sequence layout in Figure 3. Notice that you can also see the layout of my entire schema (red circle) in the Query Editor.

Figure 3: Query Editor layout

Investigate the Data

First, I want to understand my data by executing a few interesting queries.

I want to understand what months of data are in my Actian warehouse and understand some overall numbers.  (Note this blog was authored in early 2021).  I execute this query:

Figure 4: Line item statistics

Because of the speed of Actian, in just a few seconds, I gleaned some valuable information from my warehouse. It looks like I have five years’ worth of data including over 45 billion line items sold, showing an average sale of $625. That’s terrific! See Figure 4.

Also, I would like to see trended sales by month. I execute this query:

Figure 5: Trended sales

This query also finished in just a few seconds, but with all these big numbers, it’s a little hard to grasp their relative values. It will be helpful to make a chart using the Actian Query Editor’s charting function.

I’ve used the charting function (see Figure 6) to create a bar chart. I’m running the same query essentially, but I’ve simplified it and limited the output to just last year. It’s easy to see now, that my sales really accelerated around Christmas. I’ve shown how I configured this chart in Figure 7.

Figure 6: Trended sales with chart
Figure 7: Chart configuration

Find Best-Selling Products (A)

Now that I understand my data, I execute this query to find the best-selling product categories by spend in the last year:

Figure 8: Top categories by spend

In just a few seconds, I learn that Clothing and Electronics were my best-selling product categories overall. I know that marketing always likes to work with Electronics, so I’m going to concentrate there.

Next, I want to find the top-selling products in Electronics last year. I execute this query:

Figure 9: Top products in Electronics

Again, because of the speed of Actian, in a few seconds, I learn that many of the top products in my Electronics category are Canon products.  See Figure 9.

Find Products Commonly Sold With Top Products (B)

Now I want to find the Electronics products that are most often sold with these top-selling Canon products in the last six months. This is the resource-intensive market-basket query that I referred to in my introduction.  To execute, this query will join my 45 billion line items back to the same 45 billion line items to see which items are typically bought together. I execute this query:

Figure 10: Market-basket query

This query is much more complex than the previous queries, still, it only took a mere 17 seconds to execute in Actian. It is obvious from this query that Canon customers often buy SDHC Memory Cards of different types. This is something that seems logical, of course, but I have now proven this with analytics.

Find the Customer Population Who Bought A But not B

Now I need to find the names and addresses of customers who have NOT bought memory cards. This is basically a reverse market-basket query. Actian will join the 45 billion row line item table back to itself, this time to find missing relationships…customers who have not bought memory cards. It then also needs to join the line item and order information back to the customer table to get the corresponding name and address information. Also, I need to make sure I don’t send duplicate mailings to any customer that may have bought multiple Canon products, so I have added the DISTINCT keyword to my SQL. I execute the query below. Once it is finished, I then choose the .csv download option to create an output file.  See the red circles in Figure 11.

Figure 11: Reverse market-basket.  No affinity.

Provide Appropriate Information to Marketing

I can now easily mail the .csv file of prospect customers to market so they can send out their marketing mail campaign.

Figure 12: Email with target list

In conclusion, the Actian Data Warehouse is a very powerful cloud data warehouse platform that also includes the basic tools and speed you need to be productive with affinity analytics in your business.

mary schulte headshot

About Mary Schulte

Mary Schulte is Senior Sales Engineer at Actian, drawing upon decades of experience with powerhouse database vendors like Informix and Netezza. She has written thousands of lines of Informix 4GL and ESQL/C for global clients, including American Airlines' groundbreaking datablade implementation. Mary has delivered countless training sessions, helping organizations optimize their database environments. Her posts on the Actian blog center on query performance, analytics databases like Vector, and practical tips for leveraging Informix. Browse her articles for expert guidance.
Data Architecture

Data Warehouse Best Practices

Teresa Wingfield

October 26, 2021

Data Warehouse Best Practices

In every industry, the need to follow best practices exists. Data warehouse best practices are no exception. Best practices are methods or techniques accepted as a good way or best way to accomplish an activity, process, or practice. All practices evolve, but the best way to start is with a foundation of best practices and then adapt those practices to meet the specific needs of an organization. Organizations that continually evolve their best practices based on industry, customer, and internal feedback will create unique best practices resulting in a strategic, tactical, or operational advantage over a similar organization serving the same markets.

Best practices enable assets, capabilities, and resources to deliver value to the organization, stakeholders, and customers. A data warehouse can be a strategic resource for any organization. Developing a data warehouse practice into a unique capability requires making the data warehouse best meet the organizational objectives that the data warehouse technology supports. 

Data Warehouse Best Practices

Data within an organization is sometimes not leveraged as much as it can be. Many organizations find themselves making decisions using best effort or expert opinions in most cases. These decisions can become more powerful and meaningful when backed with intelligent data, information, and knowledge relative to the needs of data consumers. To do this, organizations have to work as a team and remove as many silos as possible related to the services and products they deliver and support. Data exchanges between customers and all the functional units in the organization help make this happen.

Organizations rely on many best practices in various functions to perform as efficiently as possible. There are best practices for managing people, methods, processes, and technologies. Listed below are several best practices and data warehouse considerations that should be adopted within an organization to help enable value from a data warehouse:

  • Identify what decisions need to be made within each functional unit of the organization and how data supports their conclusions. Data should have a purpose. Data collected that does not have a goal is a waste of the organization’s precious resources. The organization must be efficient and effective with data collection, including exchanging data between functional units, transforming data into information, and then shifting it into knowledge for decision support.
  • Create models. Service models, product models, financial models, and process models help organizations understand data exchanges and the data needed by different stakeholders to define and architect the data warehouse data model. The data model helps the organization understand the value chains between different data consumers and how data should be presented.
  • Understand decisions that need to be made by each consumer of the data in the data warehouse. Analyze and understand data needs for each consumer of the data.
  • Decide governance, risk, and compliance (GRC) policies, processes, and procedures. Managing data is very important to any organization and should be treated with utmost care and responsibility. Data activities within the organization have to operate efficiently, effectively, and economically to avoid risk and resource waste.
  • Decide the type of initial data warehouse. Decide whether a 1-, 2-or 3-tier architecture is the best initial approach for your data warehouse. Remember, data warehouses support analytical processing and are not suitable for transactional processing.
  • Decide if the data warehouse should be on-premises, cloud or hybrid. This includes understanding the budget available for the overall initial program/project and its impact on the decision.
  • Decide initial sources for input into a data warehouse. Remember, data sources can grow over time as the needs of the organization grow. It is essential to make sure adding new data sources is easy to accomplish.
  • Create a project plan to break up the delivery approach into manageable units for showing value quickly using the data warehouse. Don’t try to be perfect with a never-ending project or try a big-bang approach. Show value as soon as possible. Be agile, get good enough and plan for continuous improvement.
  • Decide data warehouse needs for availability, capacity, security, and continuity. The data warehouse has to be available when needed, have enough capacity to support demand, secure and maintain levels of confidentiality, integrity, and be available to those who need it. For continuity, the data warehouse should be included in business impact analysis and risk assessment planning. Usability and performance are also considerations for data warehouse warranties to its consumers.
  • Decide how often data needs to be loaded and reconciled, based on timeliness and relevance of data change, from data warehouse sources for decisions. Use Extract, Transform and Load (ETL) to help migrate data between sources and destinations. Data warehouse staging is a best practice to help stage data on a regular schedule for data warehouse decision needs.
  • Setup data for reporting, analytics, and business intelligence. Data warehouse reporting best practices have to be enabled for ease of use by data consumers. The consumer should be able to create dynamic reports with ease from the data warehouse quickly.
  • Follow agile best practices for change, release, and deployment management to help reduce risks and increase knowledge transfer. These best practices should integrate and align with other best practices in the organization.
  • Make sure to hire experienced people who are experts in data warehouse planning, design, and implementation. Bringing the right team together is one of the most important best practices for data warehouse design, development and implementation. No matter how good the technology is, the overall results will be disappointing without the right people. Project managers, business analysts, data analysts, data engineers, data architects, security analysts, and knowledge managers are key roles that can help with a successful data warehouse.

Best practices in business intelligence and data warehousing go hand in hand. The better the data warehouse technical infrastructure, the better the organization can collect, store, analyze, and present the data for consumer intelligence. Organizations have to be careful of insufficient data quality resulting in bad data for business intelligence. The data warehouse should easily support tools or applications that need the data for business intelligence. Reporting, data mining, process analysis, performance benchmarking, and analytical tools support business intelligence and should be quickly implemented without creating homegrown solutions for the data warehouse.

In Summary

This blog has discussed many data warehouse best practices. Depending on the organization and challenges they have experienced, more best practices can be added to the ones listed above. Best practices can come from anywhere in the organization based on experiences, challenges, and the overall market dynamics that the organization faces. Data warehouses and enterprise data hubs are fast becoming a strategic component for many organizations. Since a data warehouse is a large project that will mature over time, it should become a major program in the organization. Data is the blood that runs through the organization; this will not change. Data management will advance with emerging technologies, but the purpose will remain to help the organization make better informed and more timely decisions. Make a plan to start or improve your data warehouse outcomes by using best practices and selecting the right partners, technologies, and software to aid your journey.

Actian combines one of the industry’s fastest hybrid-cloud data warehouses with self-service data integration in the cloud to create better customer insights. With an easy, drag-and-drop interface, Actian Data Platform empowers anyone in the organization – from data scientists to citizen integrators – to easily combine, clean, and analyze customer data from any source, in any location.

teresa user avatar

About Teresa Wingfield

Teresa Wingfield is Director of Product Marketing at Actian, driving awareness of the Actian Data Platform's integration, management, and analytics capabilities. She brings 20+ years in analytics, security, and cloud solutions marketing at industry leaders such as Cisco, McAfee, and VMware. Teresa focuses on helping customers achieve new levels of innovation and revenue with data. On the Actian blog, Teresa highlights the value of analytics-driven solutions in multiple verticals. Check her posts for real-world transformation stories.
Data Analytics

What is an Enterprise Data Hub?

Actian Corporation

October 25, 2021

data challenges telemetry

When managing big data, organizations will find that there will be many consumers of the vast amounts of data, ranging from applications and data repositories to humans via various analytics and reporting tools. After all, the data is an expression of the enterprise, and with digital transformation, that enterprise is increasingly expressed in the form of applications, data and services delivered. Data that is structured, unstructured, and in various formats become sources and destinations of exchanges between functional units in the organization that is no longer just done manually or with middleware but can now be hosted collaboratively utilizing data lakes, data warehouses, and enterprise data hub technologies.

The choice of which data management solution to use depends on the organization’s needs, capabilities, and the set of use cases. In many organizations, particularly large or complex ones, there is a need for all three technologies. Organizations would benefit from understanding each solution and how the solution can add value to the business, including how each solution can mature into a more comprehensive higher-performing solution for the entire organization. 

What is Enterprise Data Hub?

An Enterprise data hub helps organizations manage data directly involved – “in-line” –  with the various business processes, unlike data warehouses or data lakes, as they are more likely to be used to analyze data before or after use by various applications. Organizations can better govern data consumption by applications across the enterprise by passing it through an Enterprise data hub. Data lakes, data warehouses, legacy databases, and data from other sources such as enterprise reporting systems can contribute to governed data that the business needs.

Besides data governance protection, an enterprise data hub also has the following features:

  • Ability to make use of search engines for enterprise data. The enablement of search engines acts as filters to allow quick access to the enormous amounts of data available with an enterprise data hub.
  • Data indexing to enable faster searches of data.
  • Data harmonization enhances the quality and relevance of data for each consumer or data, including improving the transformation of data to information and information to knowledge for decision-making.
  • Data integrity, removing duplication, errors, and other data quality issues related to improving and optimizing its use by applications.
  • Stream processing binds applications with data analytics, including simplifying data relationships within the enterprise data hub.
  • Data exploration increases the understanding and ease of navigating the vast amount of data in the data hub.
  • Improved batch, Artificial Intelligence, Machine Learning processing of data because of the features listed above.
  • Data storage consolidation from many different data sources.
  • Direct consumer usage or application usage for further processing or immediate business decisions.

Enterprise data hubs can support the rapid growth of data usage in an organization. The flexibility in using multiple and disparate data sources is a massive benefit of selecting a data hub. Leveraging the features mentioned above increases this benefit.

Difference Between Enterprise Data Hub, Data Lake, and Data Warehouse

Data lakes are centralized repositories of unorganized structured, and unstructured data with no governance and specifications for organizational needs. The primary purpose of a data lake is to store data for later usage though many data lakes have developer tools that support mining the data for various forward-looking research projects.

A data warehouse organizes the stored data in a prescribed fashion for everyday operational uses, unlike a data lake. Data warehouses can be multitiered to stage data, transform data and reconcile data for usage in data marts for various applications and consumers of the data. A data warehouse is not as optimized for transactional day-to-day business needs as an enterprise data hub.

In addition to drawing data from and pushing data to various enterprise applications, an Enterprise data hub can use a data lake, data warehouse, and other data sources as input into or as destinations from the data hub. Once all the data is available for the hub, the aforementioned features, such as governance, can be applied to the data. Enterprise data hub vs data lake can be easily differentiated based on the data hub’s additional capabilities for processing and enriching the enterprise data. Enterprise data hub vs data warehouse can be confusing, but the data hub has additional capabilities for using the data more business process-oriented rather than business analytics-oriented operations.

Enterprise Data Hub Architecture

The following diagram shows a data hub architecture that includes multiple data sources, the hub itself, and the data consumers.

Enterprise Data Hub

The Enterprise data hub Architecture is designed for the most current needs of organizations. The architecture itself can grow to accommodate other data management needs, such as the usage of data in emerging technologies for decision support and business intelligence.

In Summary

With the increasing adoption of disparate data and Big Data practices, Enterprise data hubs are becoming the architectures to create a unified data integrated system to enable better business processes across the enterprise. Enterprise data hub can utilize data for any source and type to create a single source of data truth about the organization’s customer, service, and products. This single source of truth can be used collaboratively across the organization to share data for timely, higher-performing business operations, automation, and decision-making.

Organizations with data hubs and supporting data sources can become more competitive than those that do not. Data is the lifeblood of the organization that enables optimized and automated business processes and decision support for organizations to make better decisions. This capability is well worth the time and investment for the organization.

Actian can help you with your cloud data integration challenges. Actian DataConnect is a hybrid integration solution that enables you to quickly and easily design, deploy, and manage integrations on-premises, in the cloud, or hybrid environments.

actian avatar logo

About Actian Corporation

Actian empowers enterprises to confidently manage and govern data at scale. Actian data intelligence solutions help streamline complex data environments and accelerate the delivery of AI-ready data. Designed to be flexible, Actian solutions integrate seamlessly and perform reliably across on-premises, cloud, and hybrid environments. Learn more about Actian, the data division of HCLSoftware, at actian.com.