Seamlessly plugs into your data ecosystem
Actian Data Observability’s open architecture integrates with data lakes and data lakehouses, natively supporting raw formats like Apache Iceberg, Hudi, and Delta Lake.


Any system, any source, any format
Connect every data source and workflow
- Actian Data Observability’s open architecture supports monitoring data across your streams, lakes, and warehouses.
- Supports structured and semi-structured data.
- No pre-processing or transformation required.
- Easily scale your data observability as your data ecosystem changes.

Natively connects to open ecosystem
- Directly read formats like Parquet, Avro, JSON, CSV, and XML.
- Fully support DQ and Apache Hudi, Iceberg, and Delta monitoring.
- Bi-directional integration with open data catalogs like Unity and Datahub.

Highly efficient data pipeline performance
- Robust monitoring capabilities without impacting underlying system performance or inflating infrastructure costs.
- Elastic spark architecture enables scalable data profiling, investigation, and detection of data quality issues across your entire dataset.
- A dedicated compute layer separate from your data warehouse or analytical databases prevents the overload of your systems.

Integrations for seamless orchestration
- REST API- first design for easy integrations with any orchestration or validation tool.
- Set up actions based on the status of data pipelines, enabling timely error detection and response.

Discover the complete platform
Open architecture
No-code connection to data lake and lakehouse –natively supports raw formats like Iceberg, Hudi, and Delta.
Data quality
Validate every value before ingesting into AI-model, automate and orchestrate DQ workflows in AI-workloads.
Anomaly detection
No sampling, ML-driven anomaly detection on column values and business metrics.
Data layer consistency
Improve quality across bronze, silver, and gold layers embedded design patterns to stop bad data at bronze.
Data layer health
No code analysis and reporting of your data lake and lake house.
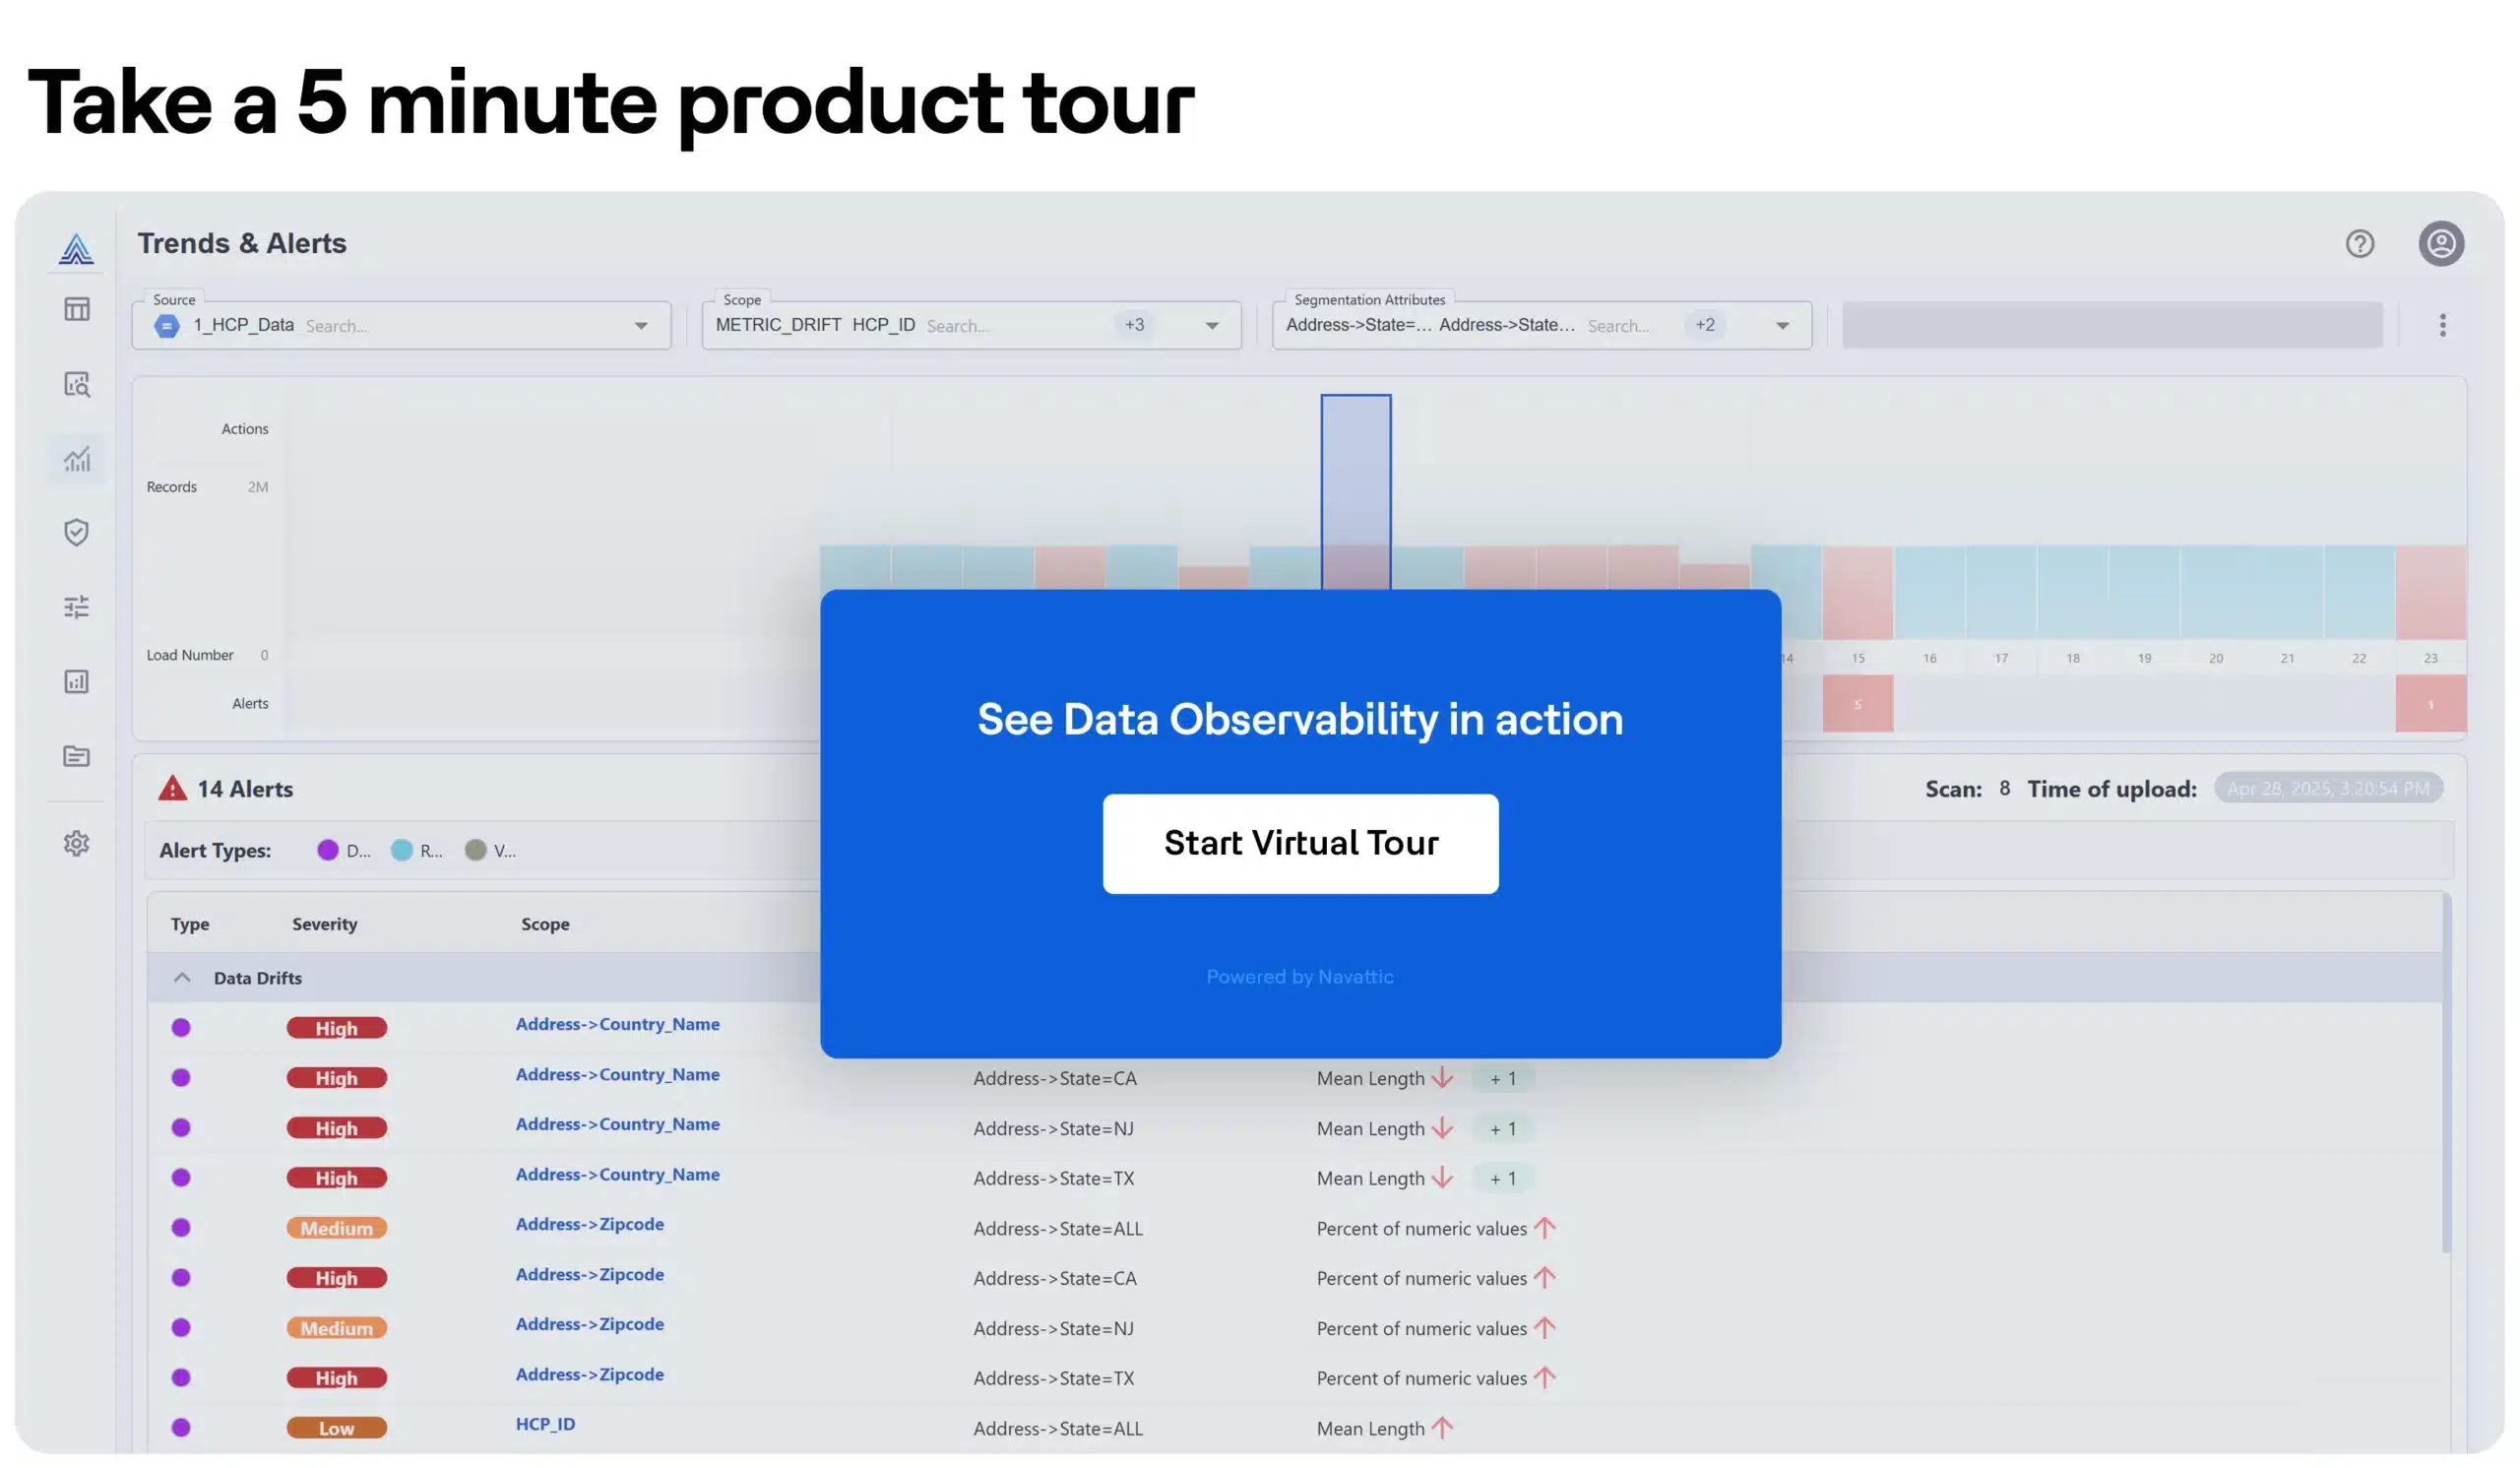
Incident management
Alerting, ticketing, investigation and remediation workflows.
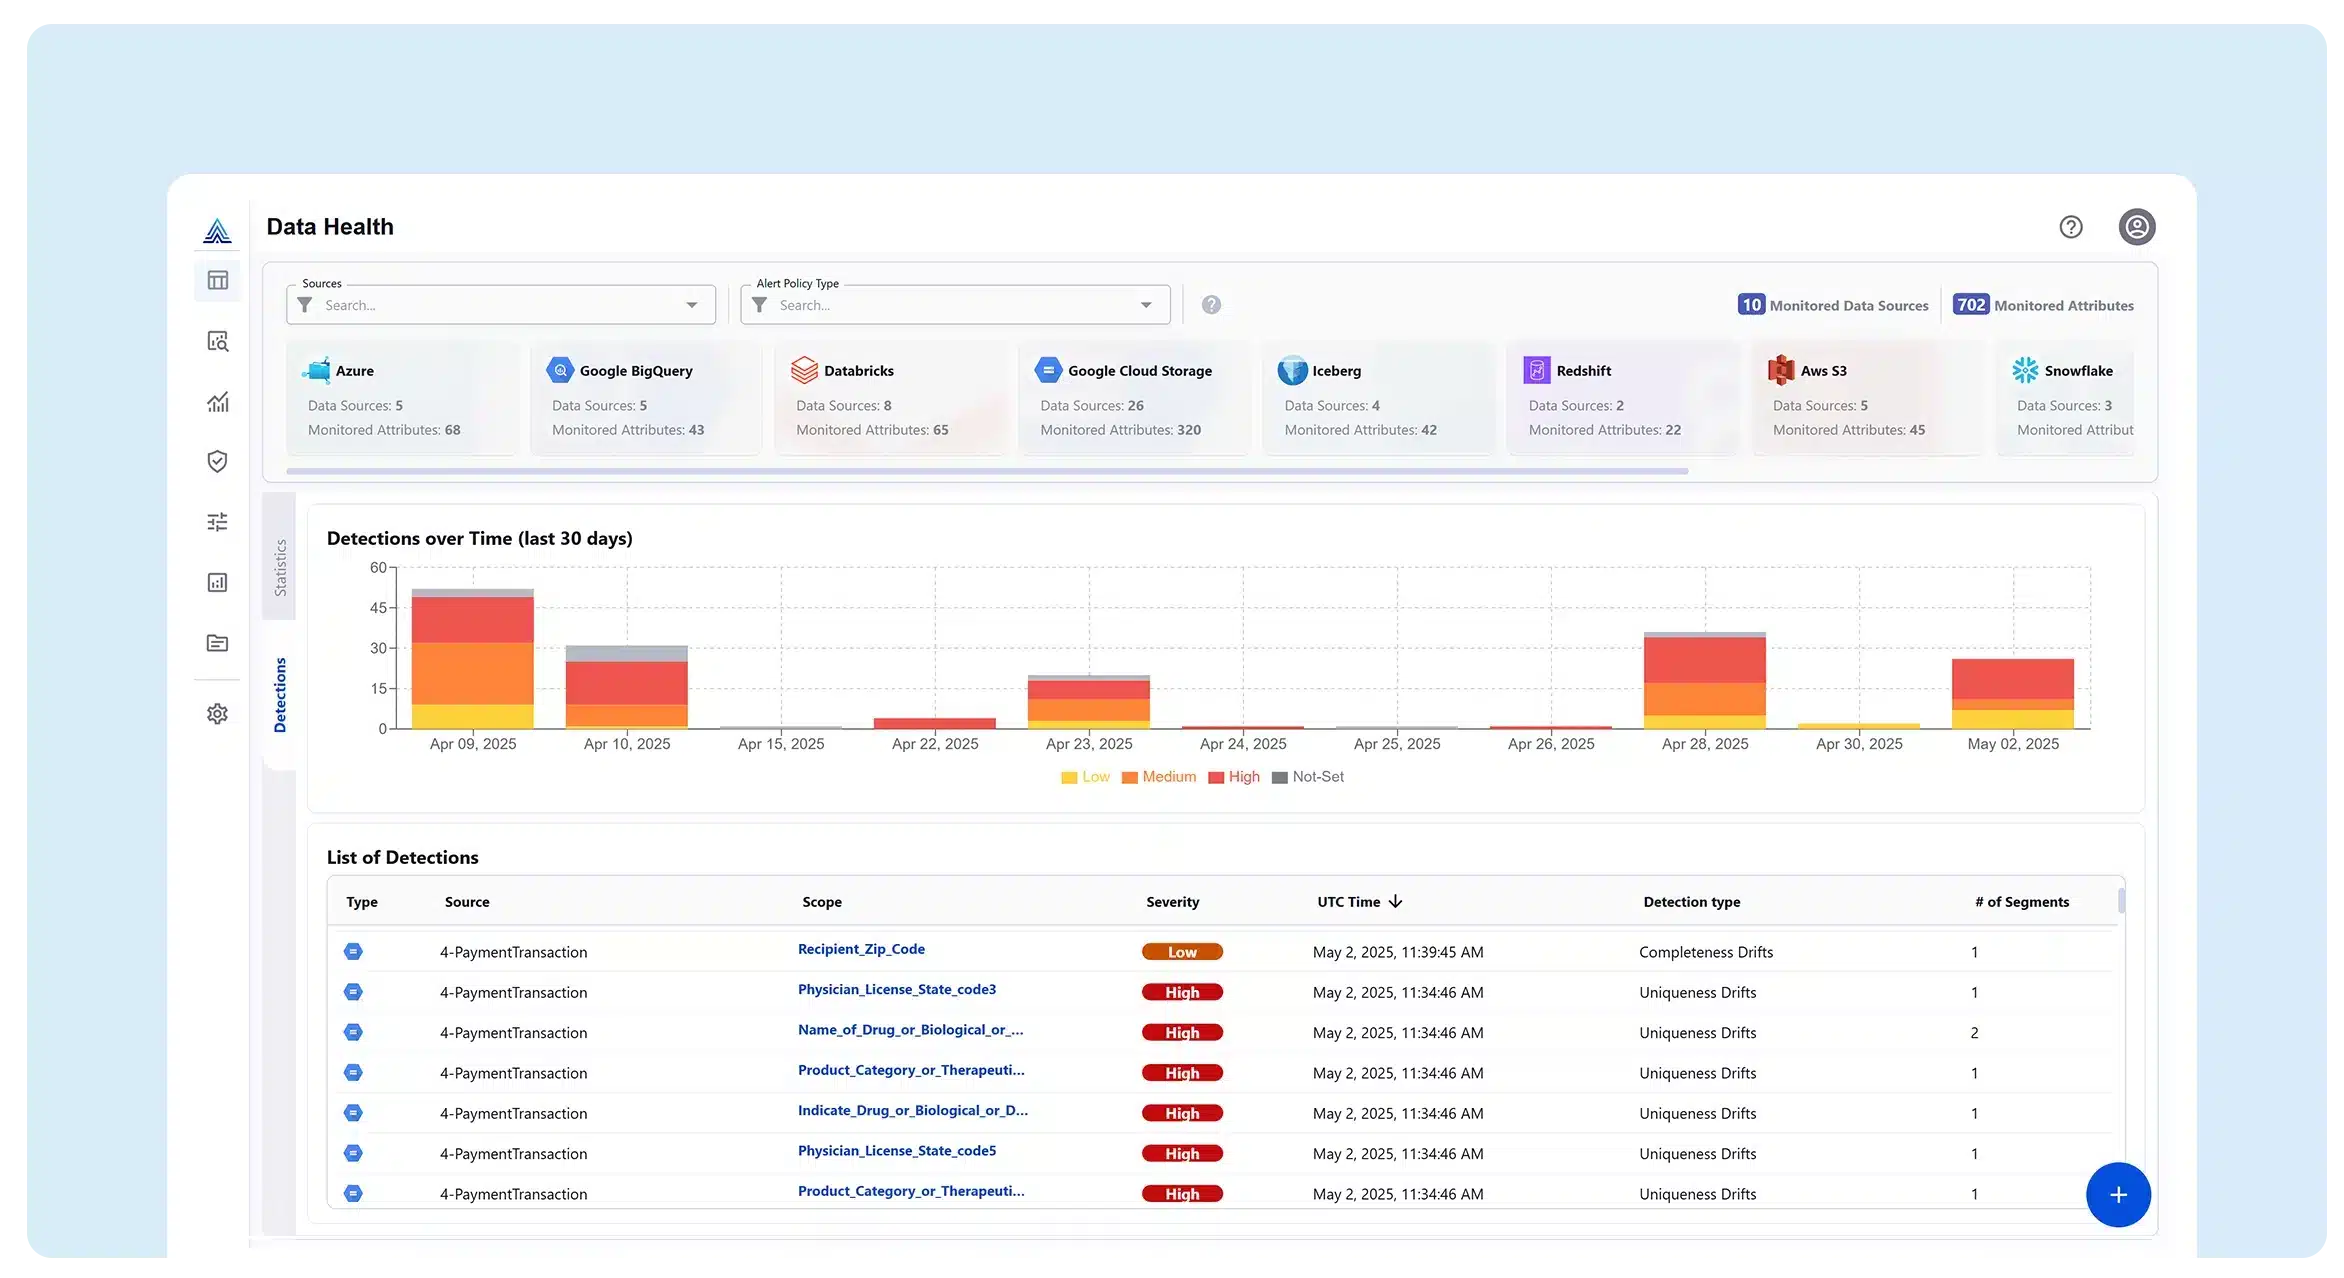
Data health dashboard
To monitor the health of your entire data pipeline on an ongoing basis, Actian provides you with a health dashboard about all your data sources and their respective health metrics. You can see your alerts and data quality KPIs and compare the current state with the last day, week, month, or quarter averages.