Knowledge Graphs, Explained


Today, vast amounts of information are constantly generated and consumed, and making sense of this data in a structured and meaningful way is crucial. This is where knowledge graphs can help. Knowledge graphs are powerful tools for organizing, connecting, and utilizing information. They are at the heart of modern artificial intelligence (AI) and are crucial in enhancing search engines, recommendation systems, virtual assistants, and more.
In this article, we will explore knowledge graphs, how they work, and the many ways they are applied across various industries.
What is a Knowledge Graph?
A knowledge graph is a way of representing knowledge that structures information in the form of entities, relationships, and attributes. It connects concepts by illustrating how they are related, offering a network of facts that enables deeper insights and a better understanding of the world.
At its core, a knowledge graph consists of:
- Entities (or nodes): These are the subjects or objects in the graph. An entity can represent anything from people and places to products and events.
- Relationships (or edges): These define how entities are related to each other. Relationships are typically verbs or actions that describe the connection, such as “works at,” “is a part of,” or “is located in.”
- Attributes: These are properties or characteristics of entities that provide more detailed information. For example, an entity “Alice” may have attributes like age, occupation, and email address.
How Does a Knowledge Graph Work?
A knowledge graph works by representing real-world entities and their relationships in a networked, graphical structure. Here’s a closer look at how it functions.
Data Ingestion
Knowledge graphs are populated with data from various sources. This can include structured data (such as databases), unstructured data (like text from documents or web pages), or data from user interactions. The challenge is to identify relevant entities and relationships from these different data sources and organize them in a way that is consistent and useful.
Entity Recognition and Linking
One of the first steps is identifying the entities in the data. This process, known as entity recognition, involves detecting words or phrases that represent entities (such as “Albert Einstein” or “Eiffel Tower”). Once identified, the system links these entities to existing nodes in the graph. If the entity is new, it is added as a new node with the relevant attributes.
Relationship Discovery
Once entities are recognized, the system identifies the relationships between them. For example, in a news article, it might detect that “John Doe” and “XYZ Corp” are related by the relationship “CEO of.” These relationships link nodes in the graph, allowing the graph to represent not just the entities themselves, but also how they connect.
Contextual Understanding
Knowledge graphs go beyond simple data storage. They are designed to understand the context of the information they represent. For instance, a search engine using a knowledge graph can interpret the query “How tall is the Eiffel Tower?” and correctly associate “Eiffel Tower” with the appropriate entity in the graph, using the relationship “has height” to retrieve the correct answer.
Inference and Reasoning
Knowledge graphs can also perform reasoning or inference. The system can make educated guesses about new relationships or facts by analyzing the connections between entities. For example, if the graph knows that “John is the CEO of XYZ Corp” and “XYZ Corp is based in New York,” it can infer that John might live in New York as well.
How Are Knowledge Graphs Used?
Knowledge graphs are not just theoretical constructs. They are widely used in practical, real-world applications. Here are a few prominent examples:
- Search engines: Search engines like Google use knowledge graphs to provide more relevant and context-aware search results. Rather than simply matching keywords, Google’s knowledge graph understands the relationships between words and concepts.
- Recommendation systems: E-commerce platforms and streaming services rely heavily on knowledge graphs to recommend products or content. By analyzing the relationships between products, genres, ratings, and users, the system can suggest items a user might be interested in based on their preferences and browsing history.
- Virtual assistants: Digital assistants such as Amazon Alexa, Apple’s Siri, and Google Assistant use knowledge graphs to answer questions and carry out tasks. These systems analyze user queries, understand the relationships between entities, and provide intelligent responses.
- Healthcare: Knowledge graphs link medical entities like diseases, symptoms, medications, and patients. By connecting different aspects of patient data, healthcare professionals can gain better insights into diagnoses, treatment plans, and medical research. They can also help identify patterns, suggest alternative treatments, or find drug interactions that might not be immediately obvious.
- Finance: Banks and financial institutions use knowledge graphs to detect fraudulent activities, analyze market trends, and improve customer experiences. By connecting various economic entities, knowledge graphs can uncover suspicious patterns, predict market movements, and provide personalized financial advice.
Knowledge Graph Example
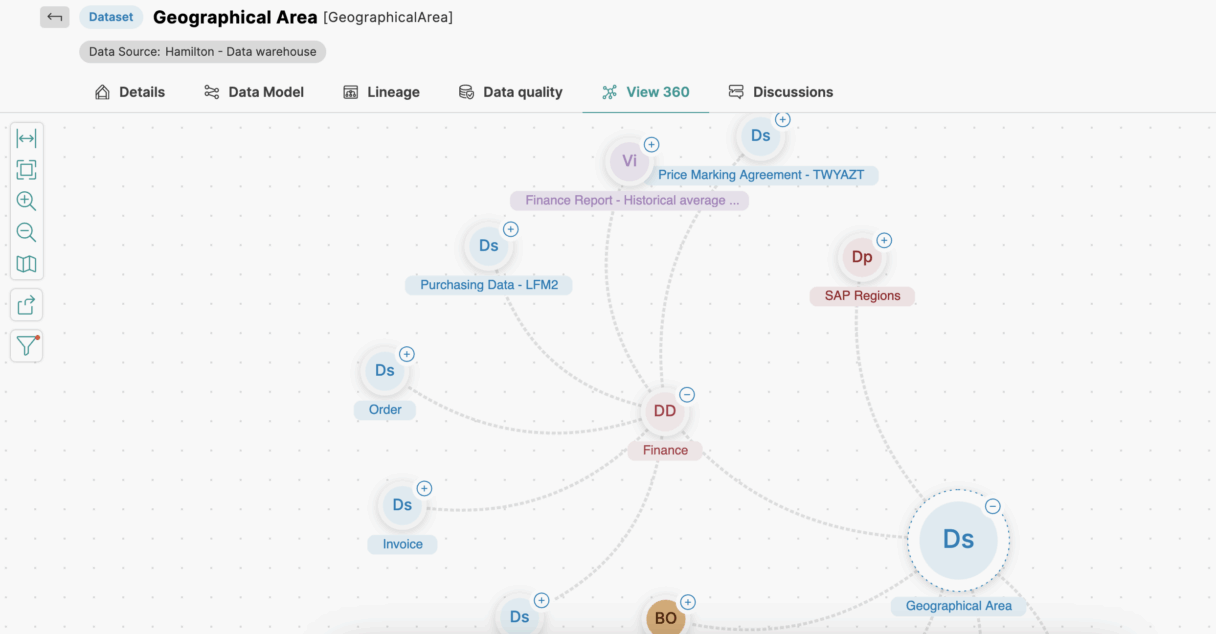
Wikidata is a popular knowledge graph that is open and collaboratively maintained. It is a centralized database for structured data used by Wikipedia and other Wikimedia projects. It connects entities (such as people, events, places, etc.) and provides relationships. For example:
- Entity: “Leonardo da Vinci”
- Attribute: “Born in 1452”
- Relationship: “Was an artist”
- Related Entity: “Mona Lisa” (painting by Leonardo da Vinci)
Wikidata is a global, community-driven knowledge graph that can be queried for more than just Wikipedia-related data, and it powers many external applications as well.
This is just one example, but knowledge graphs are used in a variety of other domains, such as healthcare, finance, and e-commerce, to improve information organization and retrieval.
Improve Data Relationships and Discovery with Actian Data Intelligence
Knowledge graphs are transformative tools that enable AI systems to understand and interpret the world in a more structured and meaningful way. By organizing information as interconnected entities and relationships, they allow systems to answer questions, make predictions, and provide personalized experiences.
Whether it’s improving search results, making recommendations, or assisting in decision-making, knowledge graphs are playing a central role in shaping the future of technology. As AI evolves, knowledge graphs will undoubtedly remain essential to intelligent systems, driving innovation across industries.
Finding relevant data has never been easier with the Actian Data Intelligence Platform. It uses knowledge graphs and smart searching capabilities to help data consumers quickly find the relevant data for their business use cases. Request a demo today.

Stay connected
Data insights delivered to you.
(i.e. sales@..., support@...)