Skip to content
  • HCLSoftware
  • Support
  • Community
  • Downloads
  • Documentation
  • Login
A graphic logo of the Actian Company
  • Products Products
    • blue data icon for Actian

      Data + AI Intelligence

      Actian Data Intelligence Platform New
      Find, trust, and unlock the value of data with a complete governance and marketplace platform
      Actian Data Observability New
      AI-based data quality and observability built for open architecture
      Actian Data Platform
      Easily connect, manage, and analyze data with a unified platform
    • blue Database icon for Actian

      Databases

      • Zen
        Low-maintenance embedded database
      • Actian NoSQL
        Databases for complex object networks
      • Actian Ingres
        Scalable and reliable transactional processing
      • HCL Informix®
        Fast, cost-optimized enterprise data management
    • blue line chart icon for Actian

      Analytics

      • Vector
        High performance, vectorized columnar analytics database
    • integrations

      Data Management

      • DataConnect
        Highly scalable hybrid integration solution
      • Data Quality
        Make informed decisions that drive your business forward
      • DataFlow
        Parallel execution platform data-in-motion
    • Bar Chart blue icon

      App Modernization

      • OpenROAD
        Database, object-oriented rapid app development
      • VoltMX
        Low code app development platform
    • See All Actian Products
    • blue square with right arrow pointing up

      Deployment

      Deployment

      Cloud, hybrid and on-premises

      • Google Cloud Launch your journey to Google with Actian
      • Amazon Web Services Launch your journey to AWS with Actian
      • Microsoft Azure Launch your journey to Azure with Actian
    See All Actian Products Explore All Deployment Partners
  • Solutions Solutions

    Solutions by Industry

    • Manufacturing
    • Transportation and Logistics
    • Banking, Financial Services, and Insurance
    • Healthcare and Life Sciences
    • Retail and Consumer Goods
    • Energy and Utilities

    Use Cases

    • Gen AI icon
      GenAI Data Readiness A quick checklist to evaluate your GenAI readiness
    • blue layer icon for Actian
      Flexible Data Integration Collect, transform, and automate data pipelines
    • database blue icon
      Data Warehouse Modernization Low-risk, simplified migration to a modern data warehouse deployed on-premises and in multiple clouds
    • blue communications solutions icon
      Enterprise Data Marketplace Discover, access, and share data products
    • blue cloud icon for Actian
      Edge-to-Cloud Analytics Modernize application data processing and analytics at the Edge
    • blue dataflow chart icon for Actian
      Customer Data Analytics Hub Get real-time actionable customer intelligence across all your customer experience data silos
    Explore All Industry Solutions
  • Customers Customers

    Customers

    • blue users icon for actian
      Our Customers Join a growing community of businesses across diverse industries who trust Actian to unlock the power of their data

    Featured Customer Stories

    • blue user icon for actian
      Academy Bank
    • blue user icon for actian
      Tsubakimoto
    View All Customers
  • Partners Partners

    Partners

    • blue info square icon for Actian
      Program Overview Competitive solutions, industry-leading incentives and a comprehensive support package
    • blue check icon for Actian
      Become a Partner Accelerate your business with the Actian Partner Program
    • blue Bezier Icon for Actian
      Technology Partners Partnering to create a force multiplier
    • blue user icon for actian
      Refer a Lead Protect your customer, grow your business
    • Find a partner icon
      Find a Partner Leverage expertise and insights from our partner network
  • Learn Learn

    Learn

    • Image Indent Left Icon
      Blog
    • graduation hat blue icon
      Actian Academy
    • book blue icon
      Resources
    • blue icon with paper and magnifying glass for Actian
      Guides
    • blue square
      Webinars
    • blue list logo
      Glossary
    View All Resources
  • Company Company

    Company

    • blue Actian logo
      About Us
    • announcement blue icon
      Newsroom
    • question blue icon
      About HCLSoftware
    • blue briefcase icon for Actian
      Careers
    • blue users icon Actian
      Leadership
    • blue check icon for Actian
      Awards and Recognition
    • Calendar blue icon
      Events
    • message blue icon
      Contact Us
    Learn More About Actian
Take a Tour Request Demo Login
  • Support
  • Community
  • Downloads
  • Documentation
  • HCLSoftware
Learn more about our data solutions
Contact Us
Data Intelligence

Amundsen: How Lyft is Able to Easily Discover Their Data

Actian Corporation

February 27, 2020

a car for hire with lyft logo

Latest Blog Posts

Keep up with the latest data trends

Subscribe

In our last article, we spoke of Uber’s Databook , an in-house platform designed by their very own engineers with the aim to turn data into contextualized assets. In this article, we will focus on Lyft’s very own data discovery and metadata platform: Amundsen.

In response to Uber’s success, the ride-sharing market saw a major wave of competitors arrive and among those, there is Lyft.

Lyft Key Figures & Statistics

Founded in 2012 in San Francisco, Lyft operates in more than 300 cities across the United States and Canada. With over 29% of the US ride-sharing market*, Lyft has certainly secured the second position for itself, standing neck and neck with Uber. Some key statistics on Lyft include:

  • 23 million Lyft users as of January 2018.
  • More than a billion Lyft rides.
  • 1,4 million drivers (Dec. 2017).

And of course, those numbers have transformed into colossal amounts of data to manage. In a modern data-driven company such as Lyft, it is evident that the platform is powered by the data. With the rapid increase of the data landscape, it becomes increasingly difficult to know what data exists, how to access them, and what information is available.

This problem led to the creation of Amundsen, Lyft’s open-source data discovery solution and metadata platform.

Let’s Get to Know Amundsen

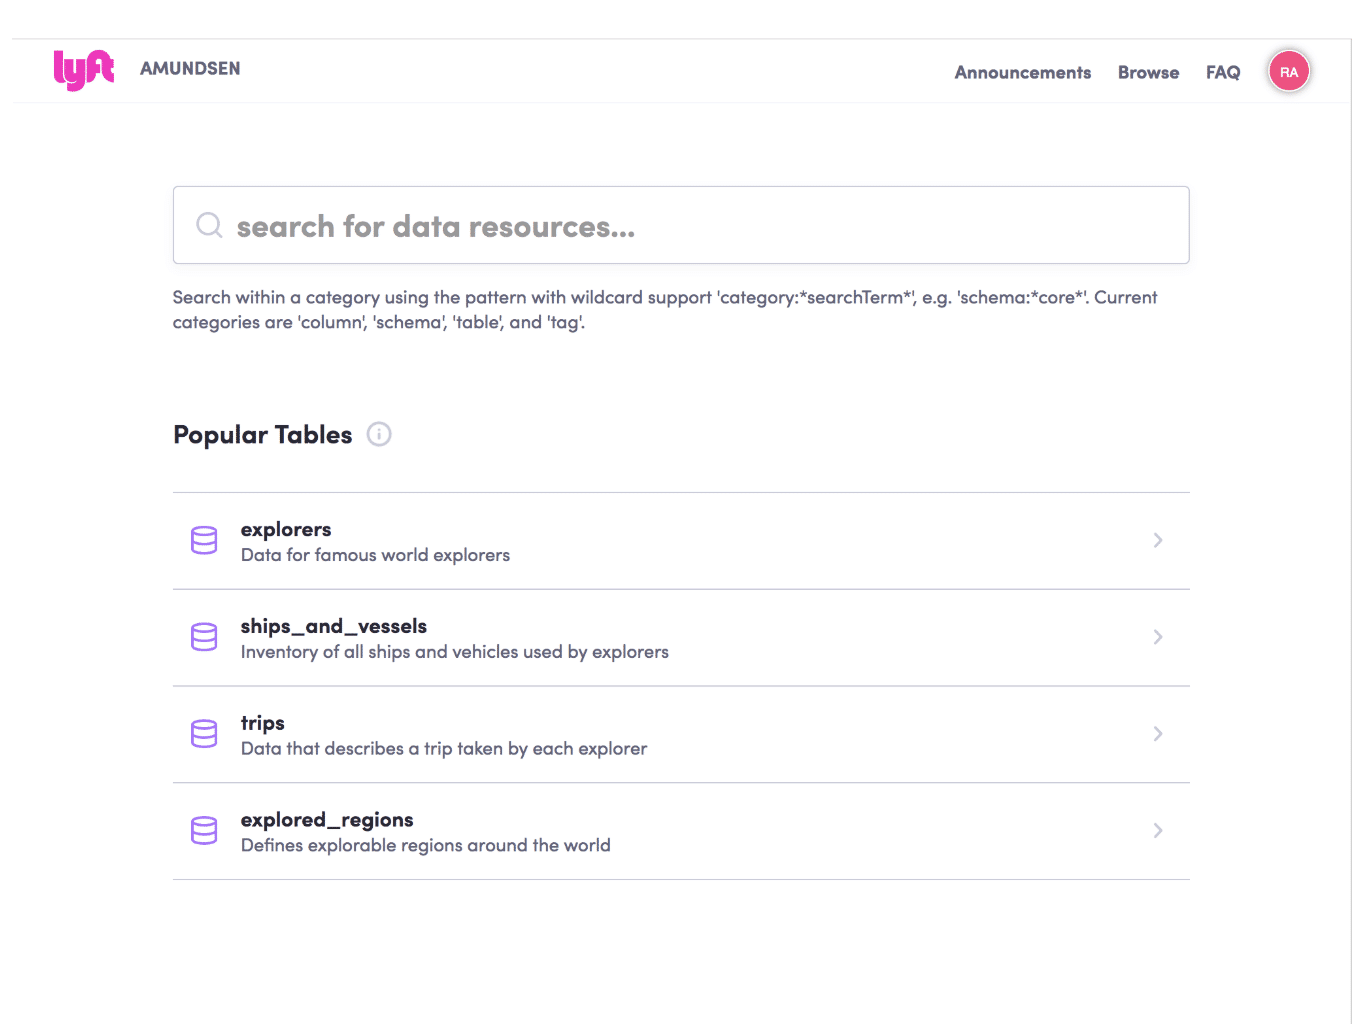
Named after the Norwegian explorer Roald Amundsen, Lyft improves their data users productivity by providing an intuitive search interface for data, that looks like this:

While Lyft’s data scientists wanted to spend the majority of the time on model development and production, they realized that most of their time was being spent on data discovery. They would find themselves asking questions such as:

  • Does this data exist? If it does, where can I find it? Can I access it?
  • Who / which team is the owner? Who are the common users?
  • Can I trust this data?

To answer these questions, Lyft was inspired by search engines like Google.

As shown above, their entry point is a simple search box where users can type any keyword such as “customers” “employees” or “price”. However, if the data user does not know what they are looking for, the platform presents the user with a list of the most popular tables, so they can browse through them freely.

Some Key Features:

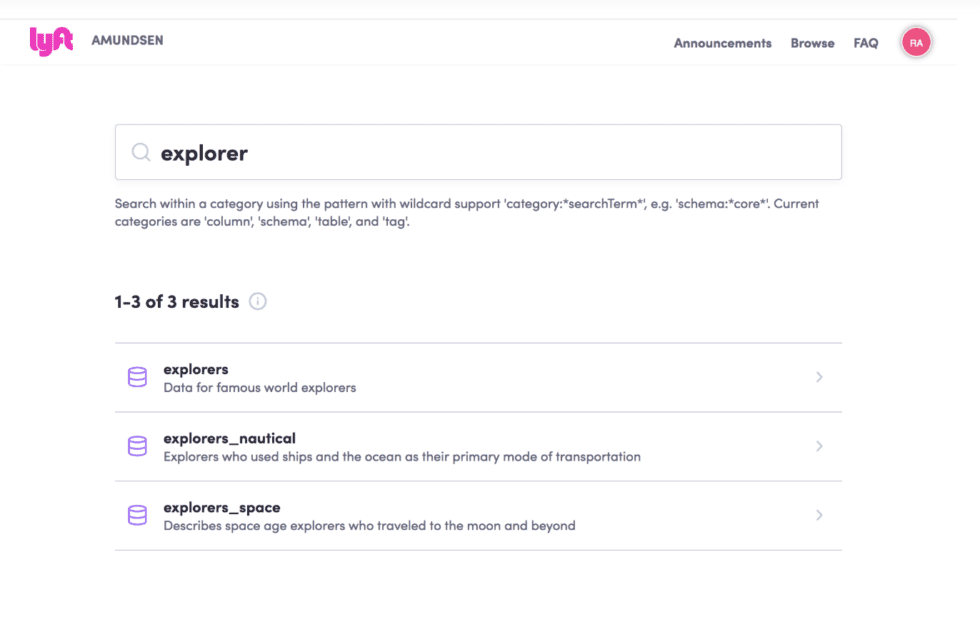
The search results are shown in “list form” where the description about the table and the date when the table was last updated appears. The ranking used is similar to Google’s Page Rank, where the most popular and relevant tables show up in the first results.

When a data user at Lyft finds what they’re looking for and selects their choice, the user is directed to a detail page which shows the name of the table as well as its manually curated description. Users can also manually insert tags, the owners, and other descriptions. However, a lot of their metadata is automatically curated such as the table’s popularity or even its frequent users.

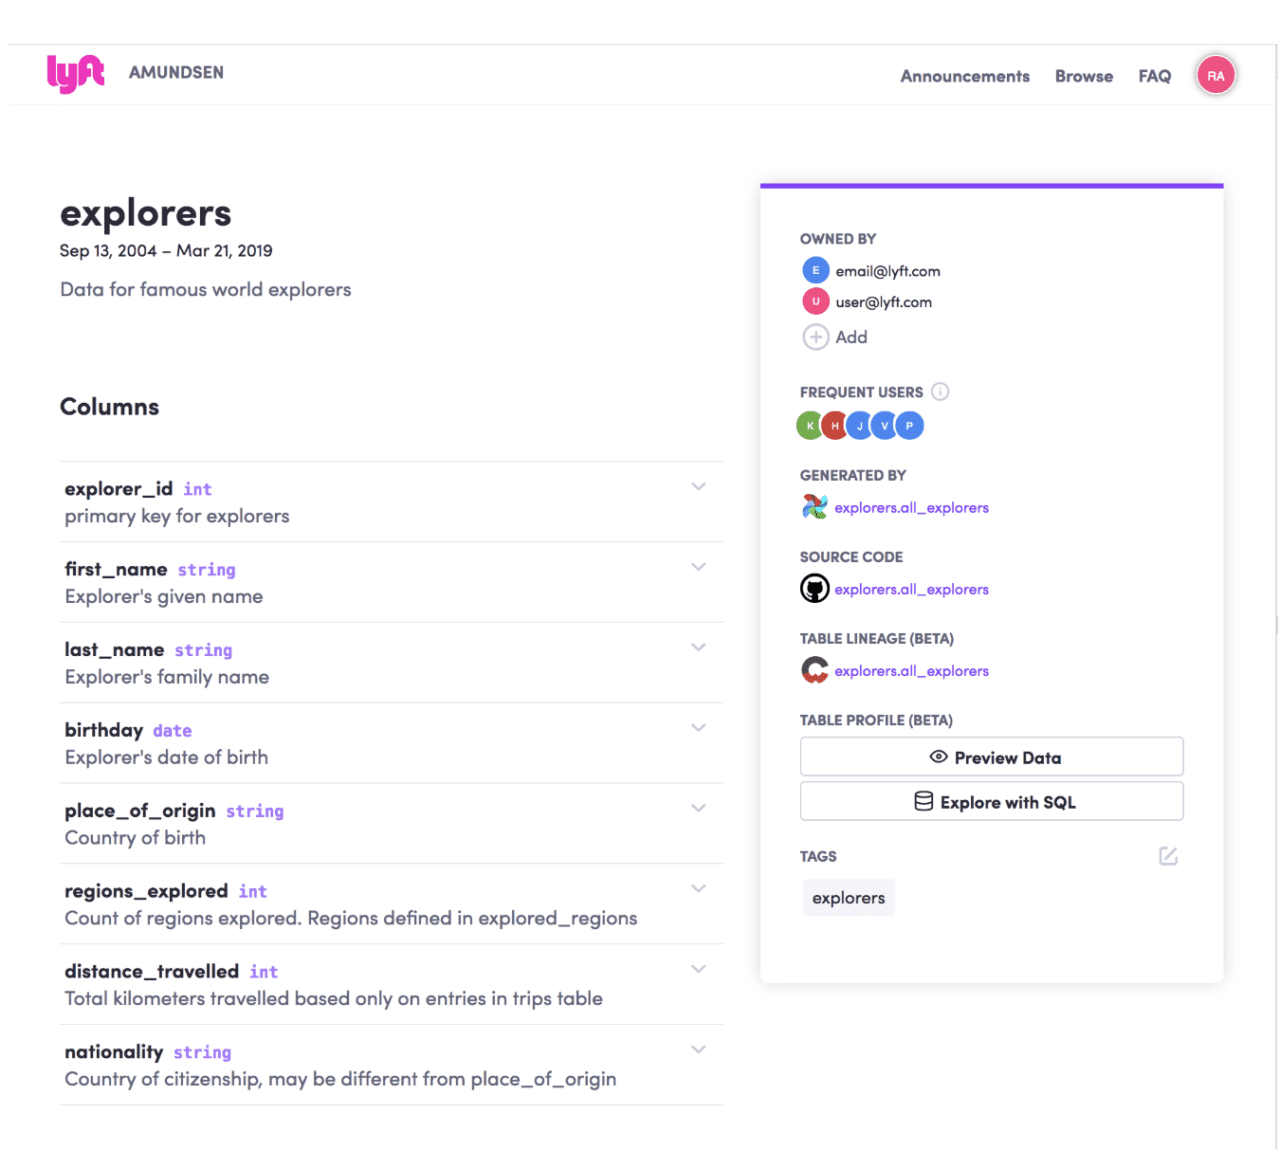
When in a table, users are able to explore the associated columns to further discover the table’s metadata.

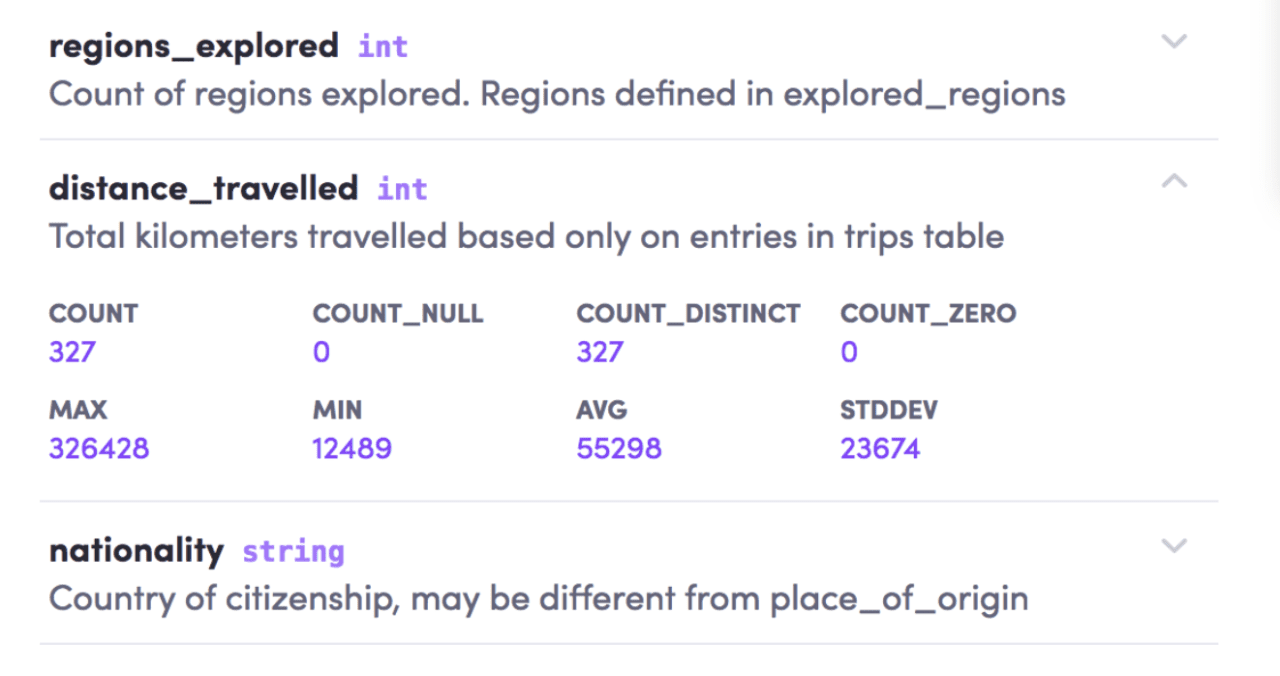
For example, if you were to select the column “distance_travelled” as shown below, you will find a small definition of the field and its related stats such as the count record, the max count, min count, average count, etc, for data scientists to better understand the shape of their data.

Lastly, users can have access to view the data of the dataset by pressing the preview button of the page. Of course, this is only possible if the user has access to the underlying data in the first place.

How Amundsen Democratizes Data Discovery

Showing the Relevant Data

Amundsen now empowers all employees at Lyft, from new employees to the most experienced, to become autonomous in their data discovery for their daily tasks.

Now let’s talk technical. Lyft’s data warehouse is on Hive and all physical partitions are stored in S3. Their data users rely on Presto, a live query engine, for their table’s discovery. In order for their search engine to show the most important or relevant tables for their users, Lyft uses the DataBuilder framework to build a query usage extractor that parses query logs to get table usage data. Then, they persist in this table usage as an Elasticsearch table document. And that’s how, in very short, they are able to retrieve the most relevant datasets for their data users.

Connecting Data With People

As much as we like to claim how technical and digital we all are, processes for finding data consists mainly in interactions with people. And the notion of Data ownership is quite confusing; it is very time consuming unless you know exactly who to ask.

Amundsen addresses this issue by creating relationships between their users and their data thus, tribal knowledge is shared through exposing these relationships.

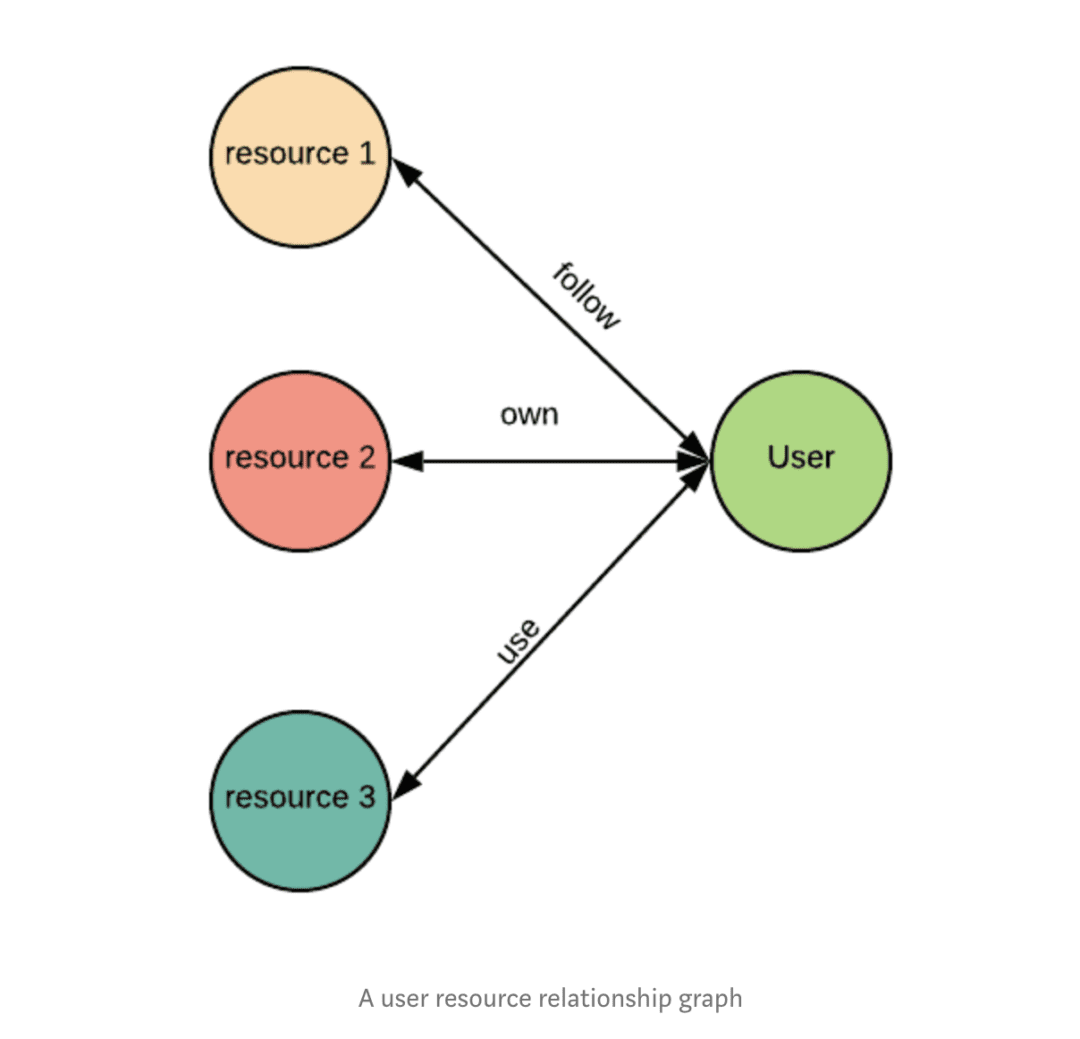
Lyft currently has three types of relationships between users and data: followed, owned and used. This information helps experienced employees become helpful resources for other employees with a similar job role. Amundsen also makes the tribal knowledge easier to find thanks to a link to each user profile on the internal employee directory.

They’ve also been working on implementing a notifications feature that would allow users to request more information from the data owners like for example, a missing description in a table.

If you’d like more information on Amundsen, please visit their website here.

What’s Next for Lyft

Lyft is hoping to continue working with a growing community to enhance their data discovery experience and boost user productivity. Their roadmap currently includes email notifications system, data lineage, UI/UX redesign, and more!

The ride sharing company has not had its final word yet.

Sources:

Lyft – Statistics & Facts: https://www.statista.com/topics/4919/lyft/
Lyft And Its Drive Through To Success: https://www.startupstories.in/stories/lyft-and-its-drive-through-to-success
Lyft Revenue and Usage Statistics (2019): https://www.businessofapps.com/data/lyft-statistics/
Presto Infrastructure at Lyft: https://eng.lyft.com/presto-infrastructure-at-lyft-b10adb9db01?gi=f100fa852946
Open Sourcing Amundsen: A Data Discovery And Metadata Platform: https://eng.lyft.com/open-sourcing-amundsen-a-data-discovery-and-metadata-platform-2282bb436234
Amundsen — Lyft’s data discovery & metadata engine: https://eng.lyft.com/amundsen-lyfts-data-discovery-metadata-engine-62d27254fbb9

actian avatar logo

About Actian Corporation

Actian makes data easy. Our data platform simplifies how people connect, manage, and analyze data across cloud, hybrid, and on-premises environments. With decades of experience in data management and analytics, Actian delivers high-performance solutions that empower businesses to make data-driven decisions. Actian is recognized by leading analysts and has received industry awards for performance and innovation. Our teams share proven use cases at conferences (e.g., Strata Data) and contribute to open-source projects. On the Actian blog, we cover topics ranging from real-time data ingestion, data analytics, data governance, data management, data quality, data intelligence to AI-driven analytics.
  • Data Discovery
  • Metadata Management
  • Share withTwitter Icon
  • Share withLinkedin Icon
  • Share withFacebook Icon
  • Share withMail Icon

Subscribe to the Actian Blog

Subscribe to Actian’s blog to get data insights delivered
right to you.

  • Stay in the know – Get the latest in data analytics pushed directly to your inbox.
  • Never miss a post – You’ll receive automatic email updates to let you know when new posts are live.
  • It’s all up to you – Change your delivery preferences to suit your needs.

Subscribe

This email extension () is not allowed. Please update.
This personal email address domain () is not allowed. Please update.

Thank you for subscribing to the Actian Blog!

Get ready to stay informed and inspired with the latest insights, trends, and updates in the world of data analytics and technology.

Expect our carefully curated articles, case studies, and industry news to land in your inbox soon.

Also of Interest:
  • Data Intelligence for Smarter Decisions
  • Get a 360-Degree Customer View
  • Flexible Data Integration

Data + AI Intelligence

  • Actian Data Intelligence Platform
  • Actian Data Observability
  • Actian Data Platform

Capabilities

  • Data Analytics
  • Databases
  • Data Integration & Quality
  • Application Services

Solutions

  • Manufacturing
  • Financial Services
  • Healthcare Data Analytics
  • Transportation & Logistics
  • Communications

Company

  • About Actian
  • About HCLSoftware
  • Events
  • Awards & Recognition
  • Newsroom
  • Press
  • Careers
  • Locations

Customers

  • Support
  • Community
  • Documentation
  • Customer Portal Login
  • Actian Data Platform Login

Get Started

  • Request Demo
  • Contact Us
Actian
© 2025 Actian Corporation. All Rights Reserved.
  • x social icon
  • facebook
  • Linkedin
  • GitHub
  • youtube
  • Terms of Use
  • Modern Slavery Policy
  • Privacy Policy
  • Trademark Guidelines
  • Patents
  • Security
hcl-logo