Actian Ingres 12.1 añade métricas OpenTelemetry para una observabilidad moderna


Resumen
- Ingres 12.1 emite métricas OpenTelemetry (OTel) para la observabilidad de bases de datos independientes del proveedor.
- La pila de Docker Compose incluye el agente OTel, Grafana Alloy, Prometheus y los paneles de Grafana.
- Envía métricas a través de OTLP a Grafana Cloud, Datadog, Elastic, New Relic u otros backends.
- Más de 100 métricas respaldan la supervisión del estado, la resolución de problemas de rendimiento y la correlación entre sistemas.
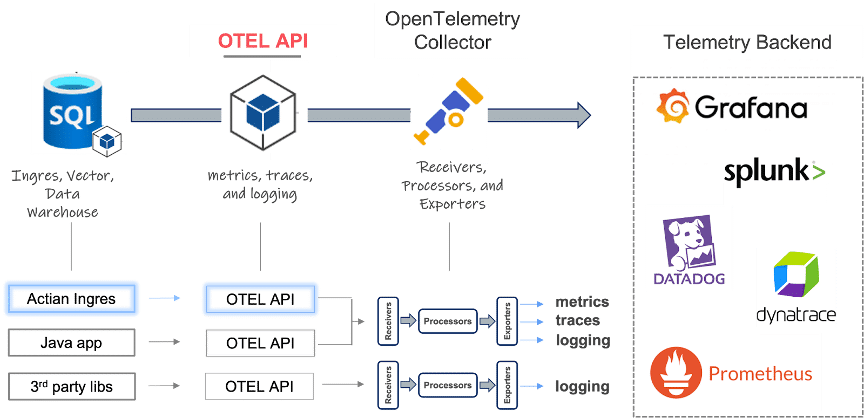
Actian Ingres 12.1 ahora emite métricas OpenTelemetry (OTel) utilizando una pila basada en Docker Compose que incluye un generador de métricas Actian, un agente Actian OTel, Grafana Alloy, Prometheus (base de datos de series temporales) y paneles de control Grafana. Esta solución, denominada Actian Monitor, puede ser descargada por los clientes de Ingres y Actian Vector a través de ESD.
Puede enviar datos a los consumidores del protocolo OpenTelemetry (OTLP) que elija, incluidos Grafana Cloud, Datadog, Elastic, New Relic y otras plataformas de observabilidad, y ampliar los paneles proporcionados o crear los suyos propios. La compatibilidad con el registro OTel está prevista en nuestra hoja de ruta para el segundo trimestre de 2026 aproximadamente.
Por qué es importante
Las bases de datos y aplicaciones modernas están cada vez más distribuidas, lo que hace que la observabilidad, es decir, la capacidad de comprender el estado y el rendimiento del sistema, sea esencial. OTel se ha convertido en el estándar del sector para recopilar métricas y registros de forma independiente del proveedor. Proporciona API, SDK y el OpenTelemetry Collector para instrumentar servicios y dirigir la telemetría a cualquier backend compatible que ingeste OTLP.
Con la incorporación de Ingres 12.1 al ecosistema OTel, los clientes de Actian se benefician de una telemetría portátil, integraciones optimizadas y una vía moderna hacia paneles unificados e información operativa.
Una introducción rápida a OpenTelemetry
OpenTelemetry es un marco de código abierto e independiente del proveedor (proyecto CNCF) que estandariza la recopilación y exportación de métricas y registros. Incluye SDK de lenguaje, autoinstrumentación y el OTel Collector para recibir, procesar y exportar señales.
OTLP es el formato de cable para mover telemetría entre aplicaciones, recopiladores y backends, a través de gRPC o HTTP, con soporte de compresión; es estable para métricas y registros.
Los OTel Collectors crean canalizaciones a partir de receptores → procesadores → exportadores. Pueden ejecutar múltiples canalizaciones para diferentes tipos de señales y distribuir datos a varios backends a la vez.
OTel ofrece un alto grado de independencia del proveedor (configurar una vez, enviar a cualquier lugar) e interoperabilidad entre proveedores de nube y herramientas.
OTel ha experimentado una rápida adopción del ecosistema por parte de proveedores como Grafana Cloud, Datadog, Elastic y New Relic, que ingestan o se integran de forma nativa con OTLP.
Beneficios que puede esperar
Los clientes de Ingres disfrutarán de las siguientes ventajas:
- Independencia del proveedor y preparación para el futuro. Introduzca el instrumento una vez y envíe la telemetría a cualquier backend OTLP sin bloqueos.
- Paneles unificados para múltiples fuentes. Combine las métricas de Ingres con otros datos de telemetría de servicios e infraestructura en una sola vista.
- Agregación y enrutamiento para su posterior procesamiento. Utilice los canales de Alloy/Collector para agregar, enriquecer y enrutar métricas a múltiples destinos.
- Determinación de problemas y salud general. Las métricas destacan la salud y las tendencias; los registros (próximamente) proporcionarán un contexto detallado.
Escenarios reales para el uso de métricas de Ingres
Cuando se gestionan sistemas complejos, las métricas sin procesar solo muestran la mitad de la historia. La verdadera magia surge cuando se conectan los puntos. A continuación, se indican algunas formas prácticas en las que los equipos están aplicando las métricas de Ingres:
- Correlacionar el rendimiento de la base de datos y la aplicación. ¿Alguna vez se ha preguntado por qué su aplicación se ralentizó después de la última actualización? Al comparar las métricas de consulta de Ingres con los datos a nivel de aplicación, puede detectar regresiones antes de que se conviertan en quejas de los clientes.
- Reúna múltiples fuentes de datos. Las métricas no viven aisladas. Coloque los datos de Ingres junto a las métricas de nodos recopiladas por Prometheus, o incluso duplíquelos en plataformas como Datadog, Elastic o New Relic. Esto le proporciona un único panel para la resolución de problemas y la optimización.
- Agregación para un análisis más profundo posterior. A veces es necesario tener una visión general. Configure Alloy para exportar métricas localmente y a sus backends en la nube. De esta manera, puede ejecutar análisis de toda la flota sin tener que buscar datos que faltan cuando más importa.
Lo que obtienes con Actian Ingres 12.1 Integración con OTel
Características y capacidades destacadas:
- Más de 100 métricas para impulsar una supervisión exhaustiva de la base de datos.
- Entregado como una pila basada en Docker Compose (implementación empaquetada) desde la generación de métricas hasta la presentación.
- Paneles predefinidos que puede utilizar tal cual o personalizar.
- Salidas flexibles: utilice la pila proporcionada, envíe a Grafana Cloud, Datadog, Elastic, New Relic o cualquier consumidor OTLP.
La pila de Docker Compose está compuesta por:
- Generador métrico Ingres.
- Agente Actian OTel para emitir métricas OTel.
- Grafana Alloy (distribución de Grafana del OTel Collector).
- Prometheus (base de datos de series temporales) para el almacenamiento y la consulta de métricas.
- Grafana para paneles de control y visualización. Los usuarios pueden habilitar la funcionalidad empresarial con una licencia de Grafana.
Flexibilidad de implementación:
- Ejecute la pila empaquetada tal cual para disfrutar de una experiencia llave en mano.
- Tener la capacidad de dirigir los exportadores OTLP a Grafana Cloud, Datadog, Elastic o New Relic.
Disponibilidad de Actian Monitor
La solución OTel de Ingres se llama Actian Monitor, y los clientes de Ingres pueden descargar el instalador a través de ESD.
Actian tiene previsto añadir compatibilidad con el registro en el segundo trimestre de 2026, completando así una sólida historia de observabilidad de métricas y registros para Ingres.
Reflexiones finales sobre la implementación de OTel
Al adoptar OTel en Ingres 12.1, Actian se alinea con las prácticas modernas de observabilidad: estándares abiertos, canalizaciones portátiles y elección de backends. Con más de 100 métricas, una pila Compose empaquetada, paneles de control preconfigurados y compatibilidad con OTLP (incluidos Grafana Cloud, Datadog, Elastic y New Relic), los usuarios de Ingres pueden combinar, comparar y analizar la telemetría en todo su ecosistema, lo que aumenta la información, la fiabilidad y la velocidad de resolución.
Descubra más sobre las nuevas funciones y ventajas de Ingres 12.1, y por qué es moderno, seguro y conectado.

Manténgase conectado
Información detallada sobre los datos a su disposición.
(por ej., ventas@..., asistencia@...)