Affinity Analytics Using Actian Cloud Data Warehouse
Mary Schulte
October 29, 2021

Affinity analytics is the practice of finding relationships and patterns in data. Businesses can use the results from affinity analytics for many positive impacts. Here are just two examples from real customer use cases. First, in retail, management wants to know what products typically sell well together for product placement and advertising purposes. This information is critical to successfully upselling additional products. Another example, telecommunications providers need to study network traffic data to understand routing patterns and maximize equipment and topography. Like these use cases, your business likely has occurrences of data affinity that you can harness to make better business decisions. Actian provides the data warehouse platform to help you do it.
Despite being clearly useful, affinity is difficult to find in traditional data warehouses because it involves executing one of the most difficult, resource-intensive SQL statements known, the fact-table self-join (also known as a “market-basket” query). This query is difficult because data warehouse “fact” tables often contain billions of rows (like mine does here), and joining billions of rows back to themselves to find affinity takes a lot of processing power. In fact, some platforms can’t do it at all, or it takes so long it’s not usable. That is where the power of the Actian Data Warehouse shines.
In this blog, I discuss how to successfully achieve affinity analytics using solely the built-in functionality of the Actian Data Warehouse, with no other tooling required!
Actian provides industry-leading cloud analytics, purpose-built for high performance. What I will show here is that Actian – natively – provides the necessary tooling to accomplish SQL analytics, allowing you can achieve things like affinity analytics without having to embark on giant, expensive projects involving additional third-party tooling.
Here is My Scenario:
I have a retail data warehouse. Marketing wants to plan an outreach mail campaign to promote sales of products that typically sell well with the store’s best-selling products. In particular, they want to mail coupons to customers that have NOT bought products that are normally bought together, but HAVE purchased at least one of the best-selling products. They would like me to provide data to support this campaign.
My Analytics Process Will Be As Follows:
- Investigate the data.
- Find best-selling products (A).
- Find products commonly sold with top products (B).
- Find the customer population who bought A but not B.
- Provide appropriate information to marketing.
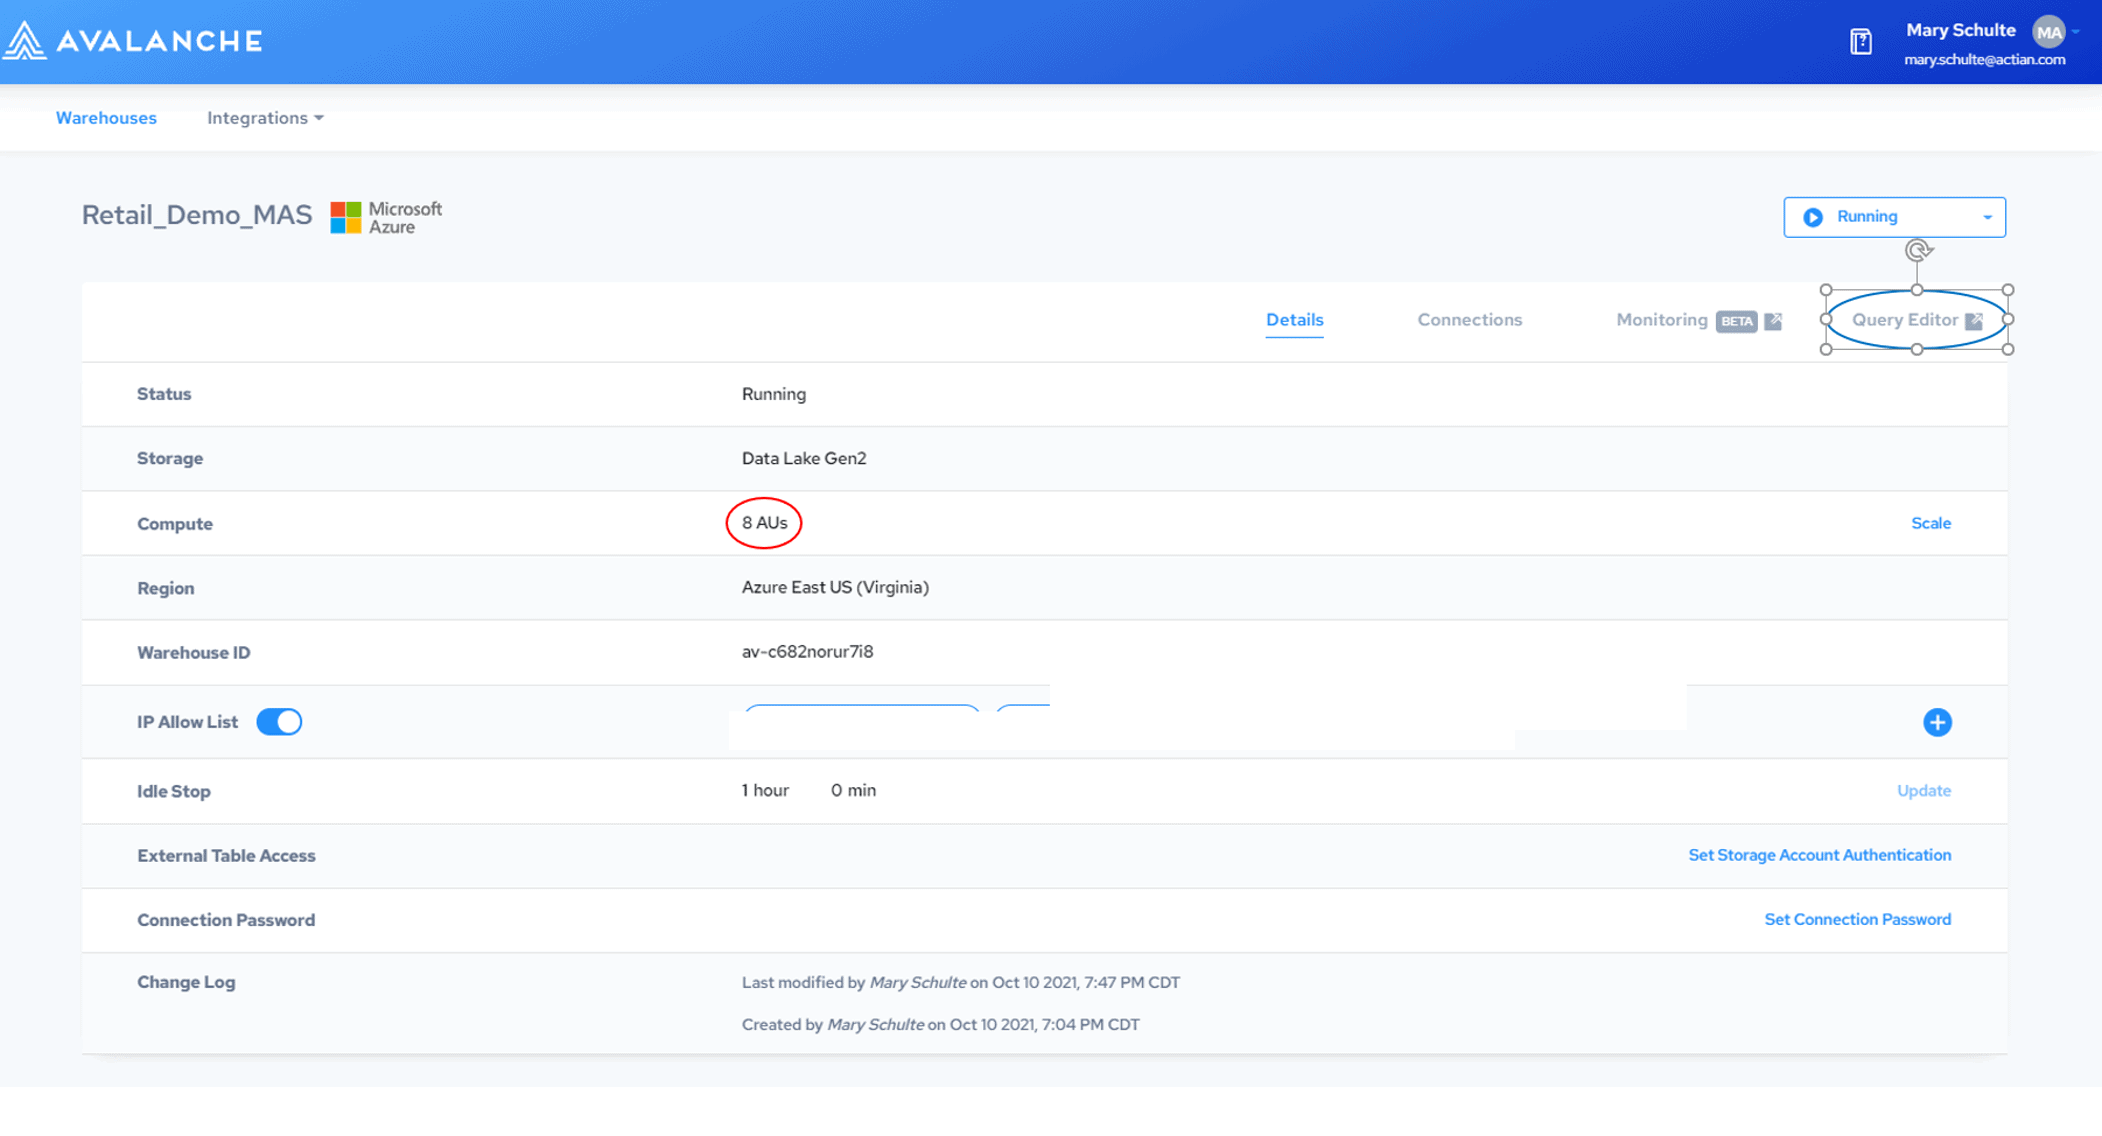
For this blog, I have created an 8 AU (Actian Unit) warehouse in the Google Cloud Platform. An Actian Unit is measure of cloud computing power that can be scaled up or down. See Figure 1.
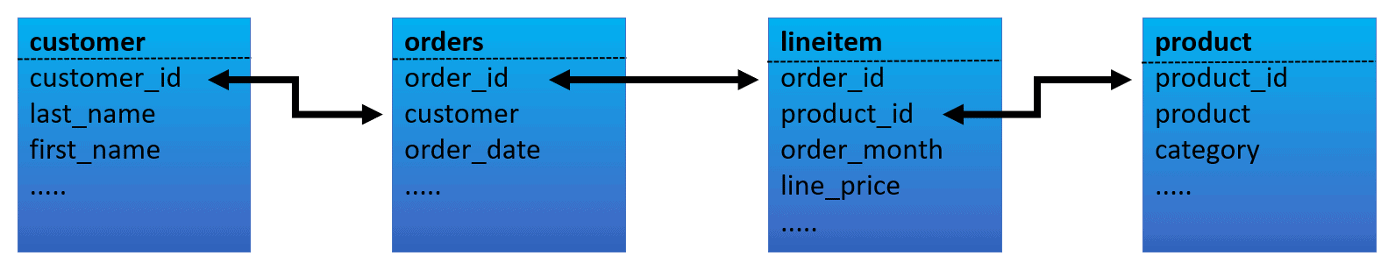
My Actian database has a typical retail schema, but for this blog, I will just focus on four tables. See Figure 2.
I have used a data generator to generate a large amount of data, but I’ve added some artificially superimposed patterns to make this blog more interesting. My tables have the following number of rows in them:
| customer | 5,182,631 |
| order | 1,421,706,929 |
| lineitem | 45,622,951,425 |
| product | 16,424 |
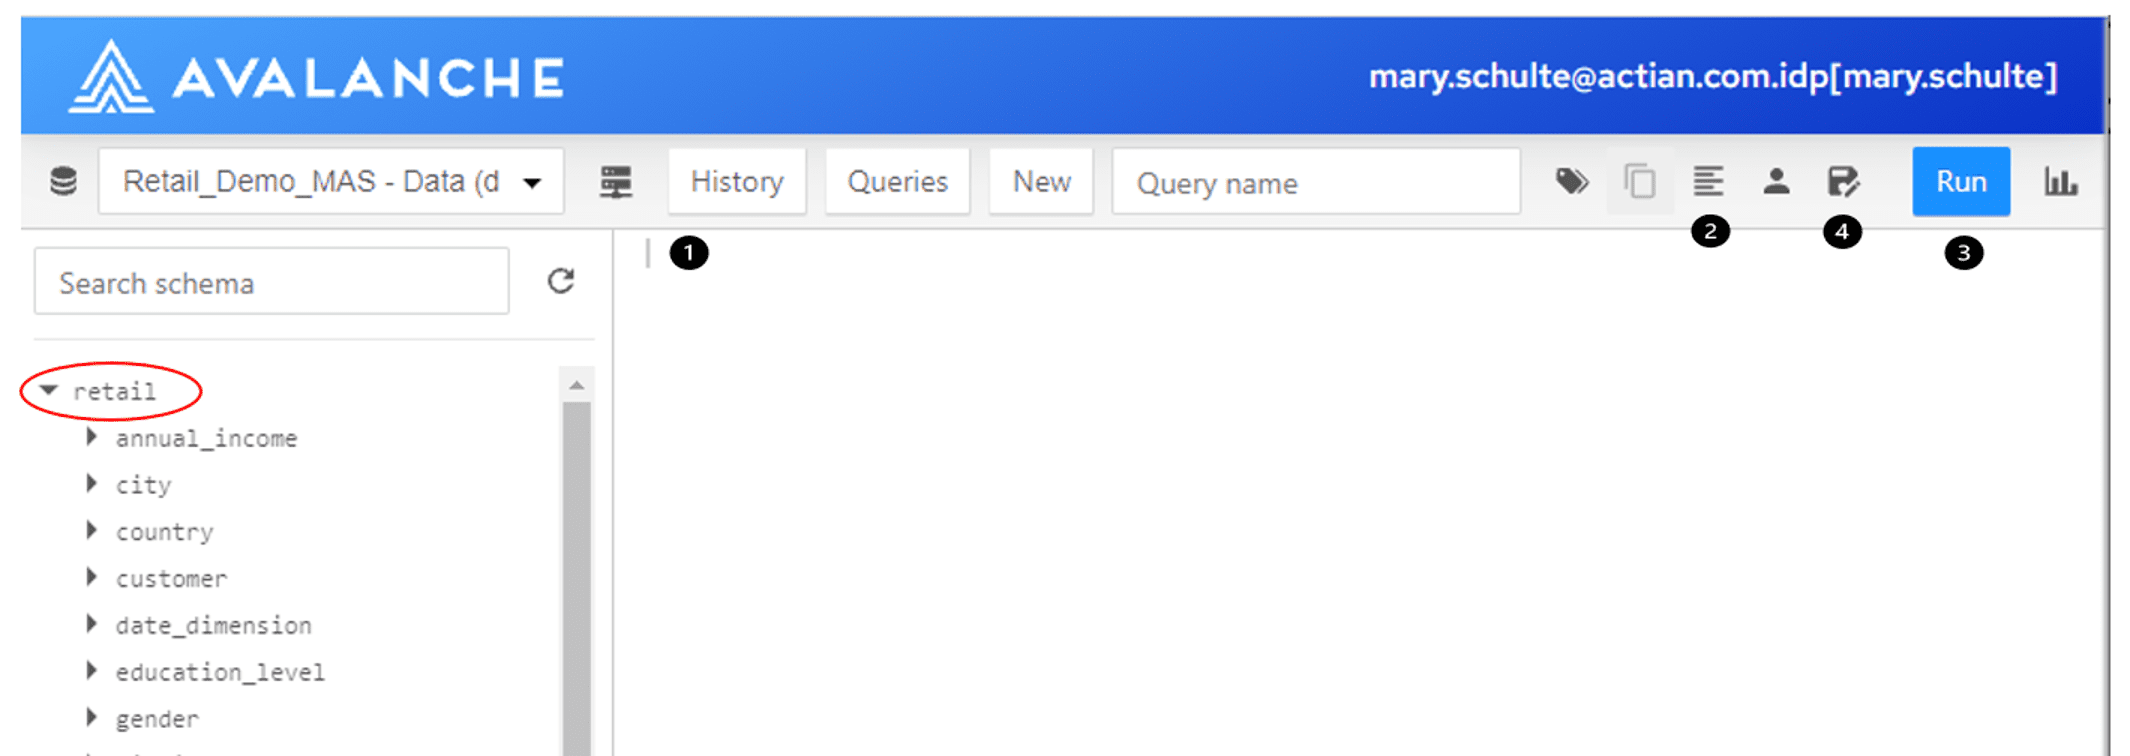
I can now use the tools provided in the Actian console Query Editor to execute my analytics process. You can find the Query Editor in the top right corner of the warehouse definition page. I have circled it in blue in Figure 1.
For all the queries in this blog, I performed the following sequence: I put my query into the query editor pane (1), formatted the query (optional) (2), then executed the query (3), then saved the query (4) for future reference. See sequence layout in Figure 3. Notice that you can also see the layout of my entire schema (red circle) in the Query Editor.
Investigate the Data
First, I want to understand my data by executing a few interesting queries.
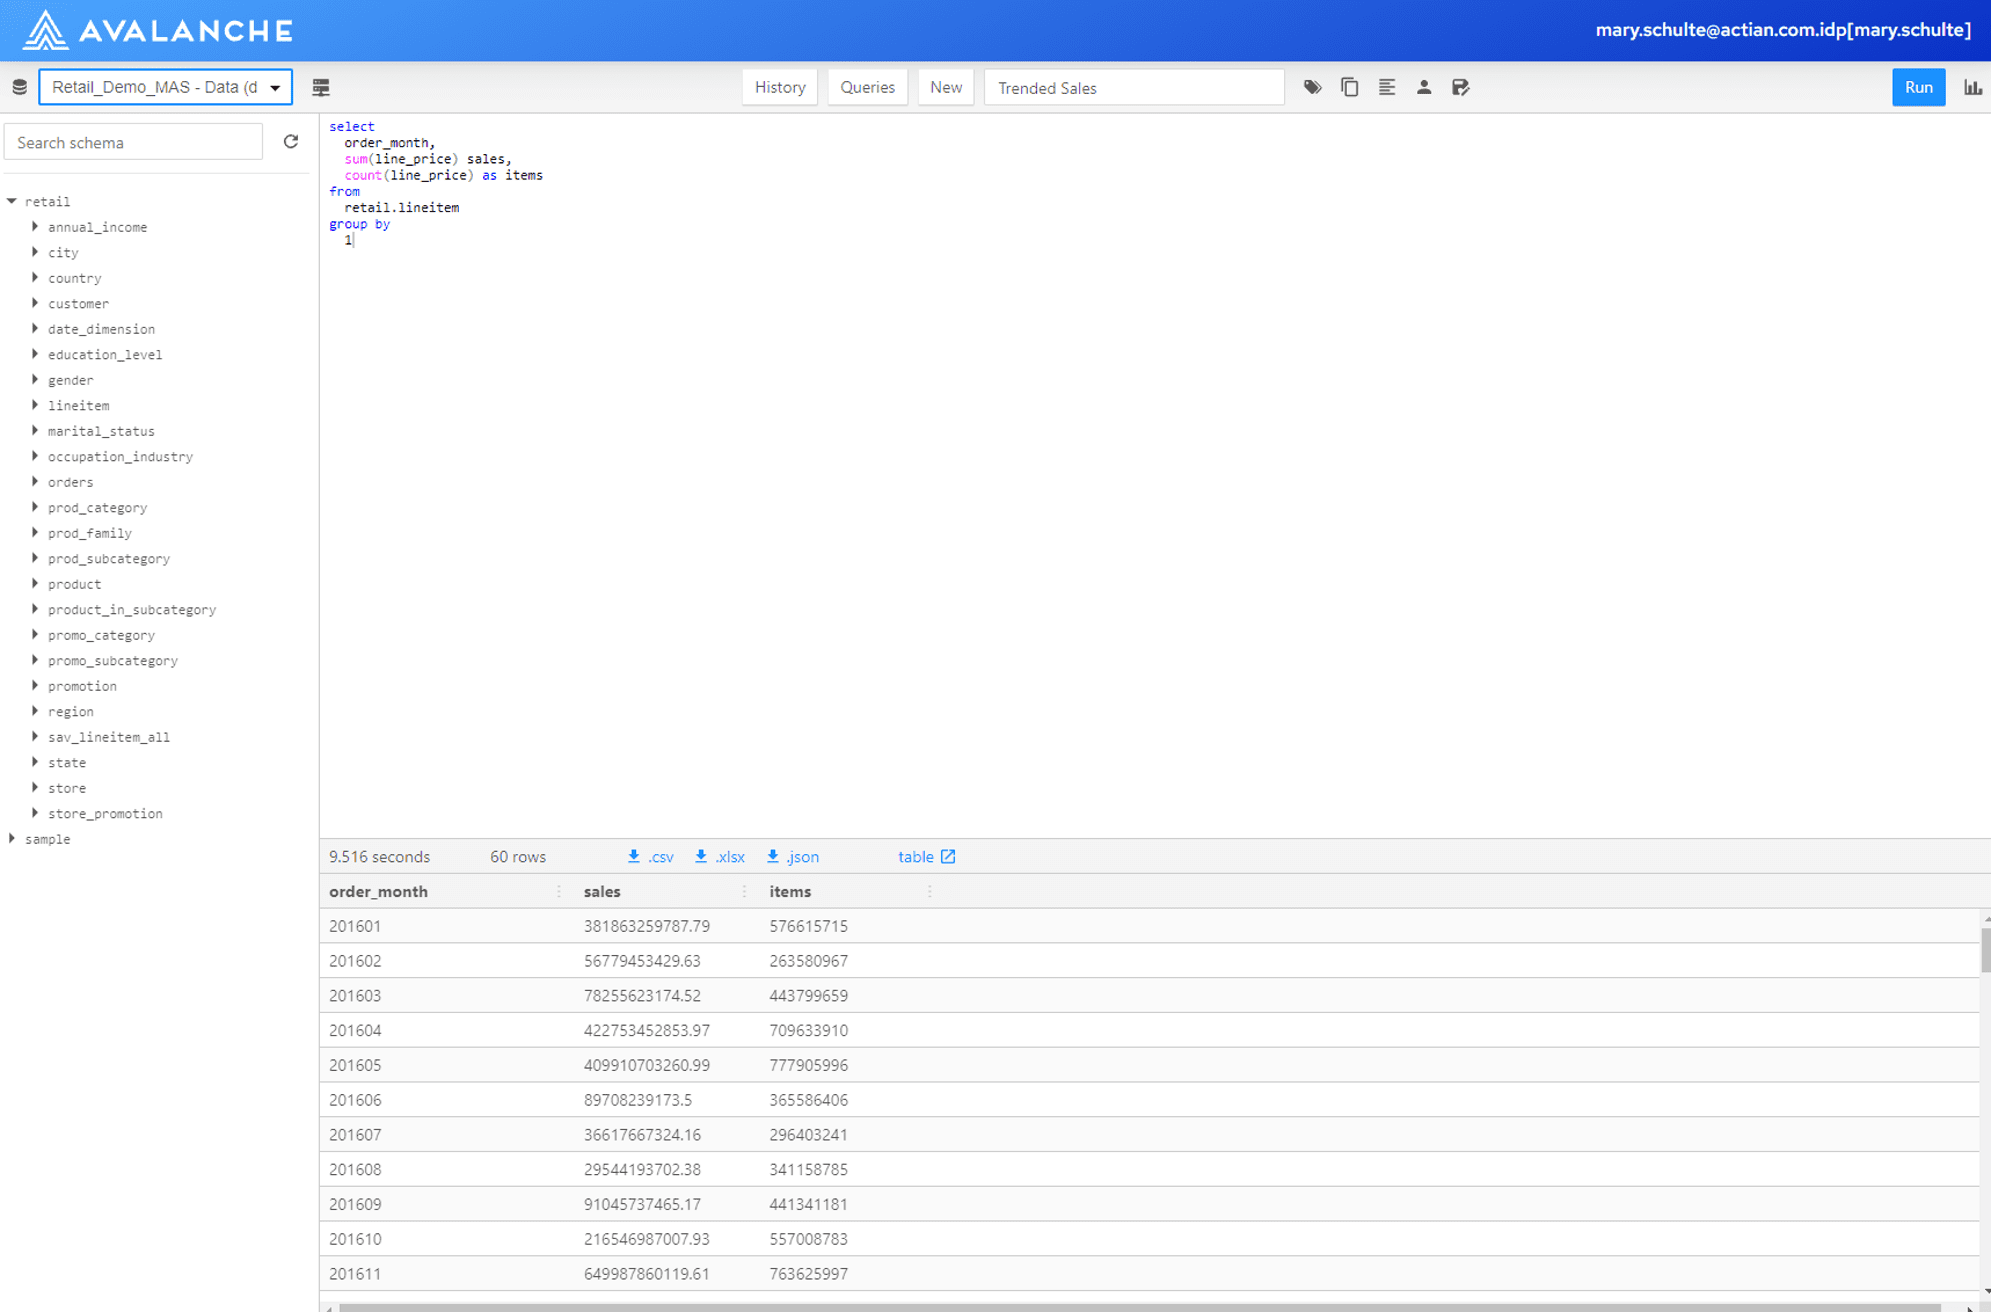
I want to understand what months of data are in my Actian warehouse and understand some overall numbers. (Note this blog was authored in early 2021). I execute this query:
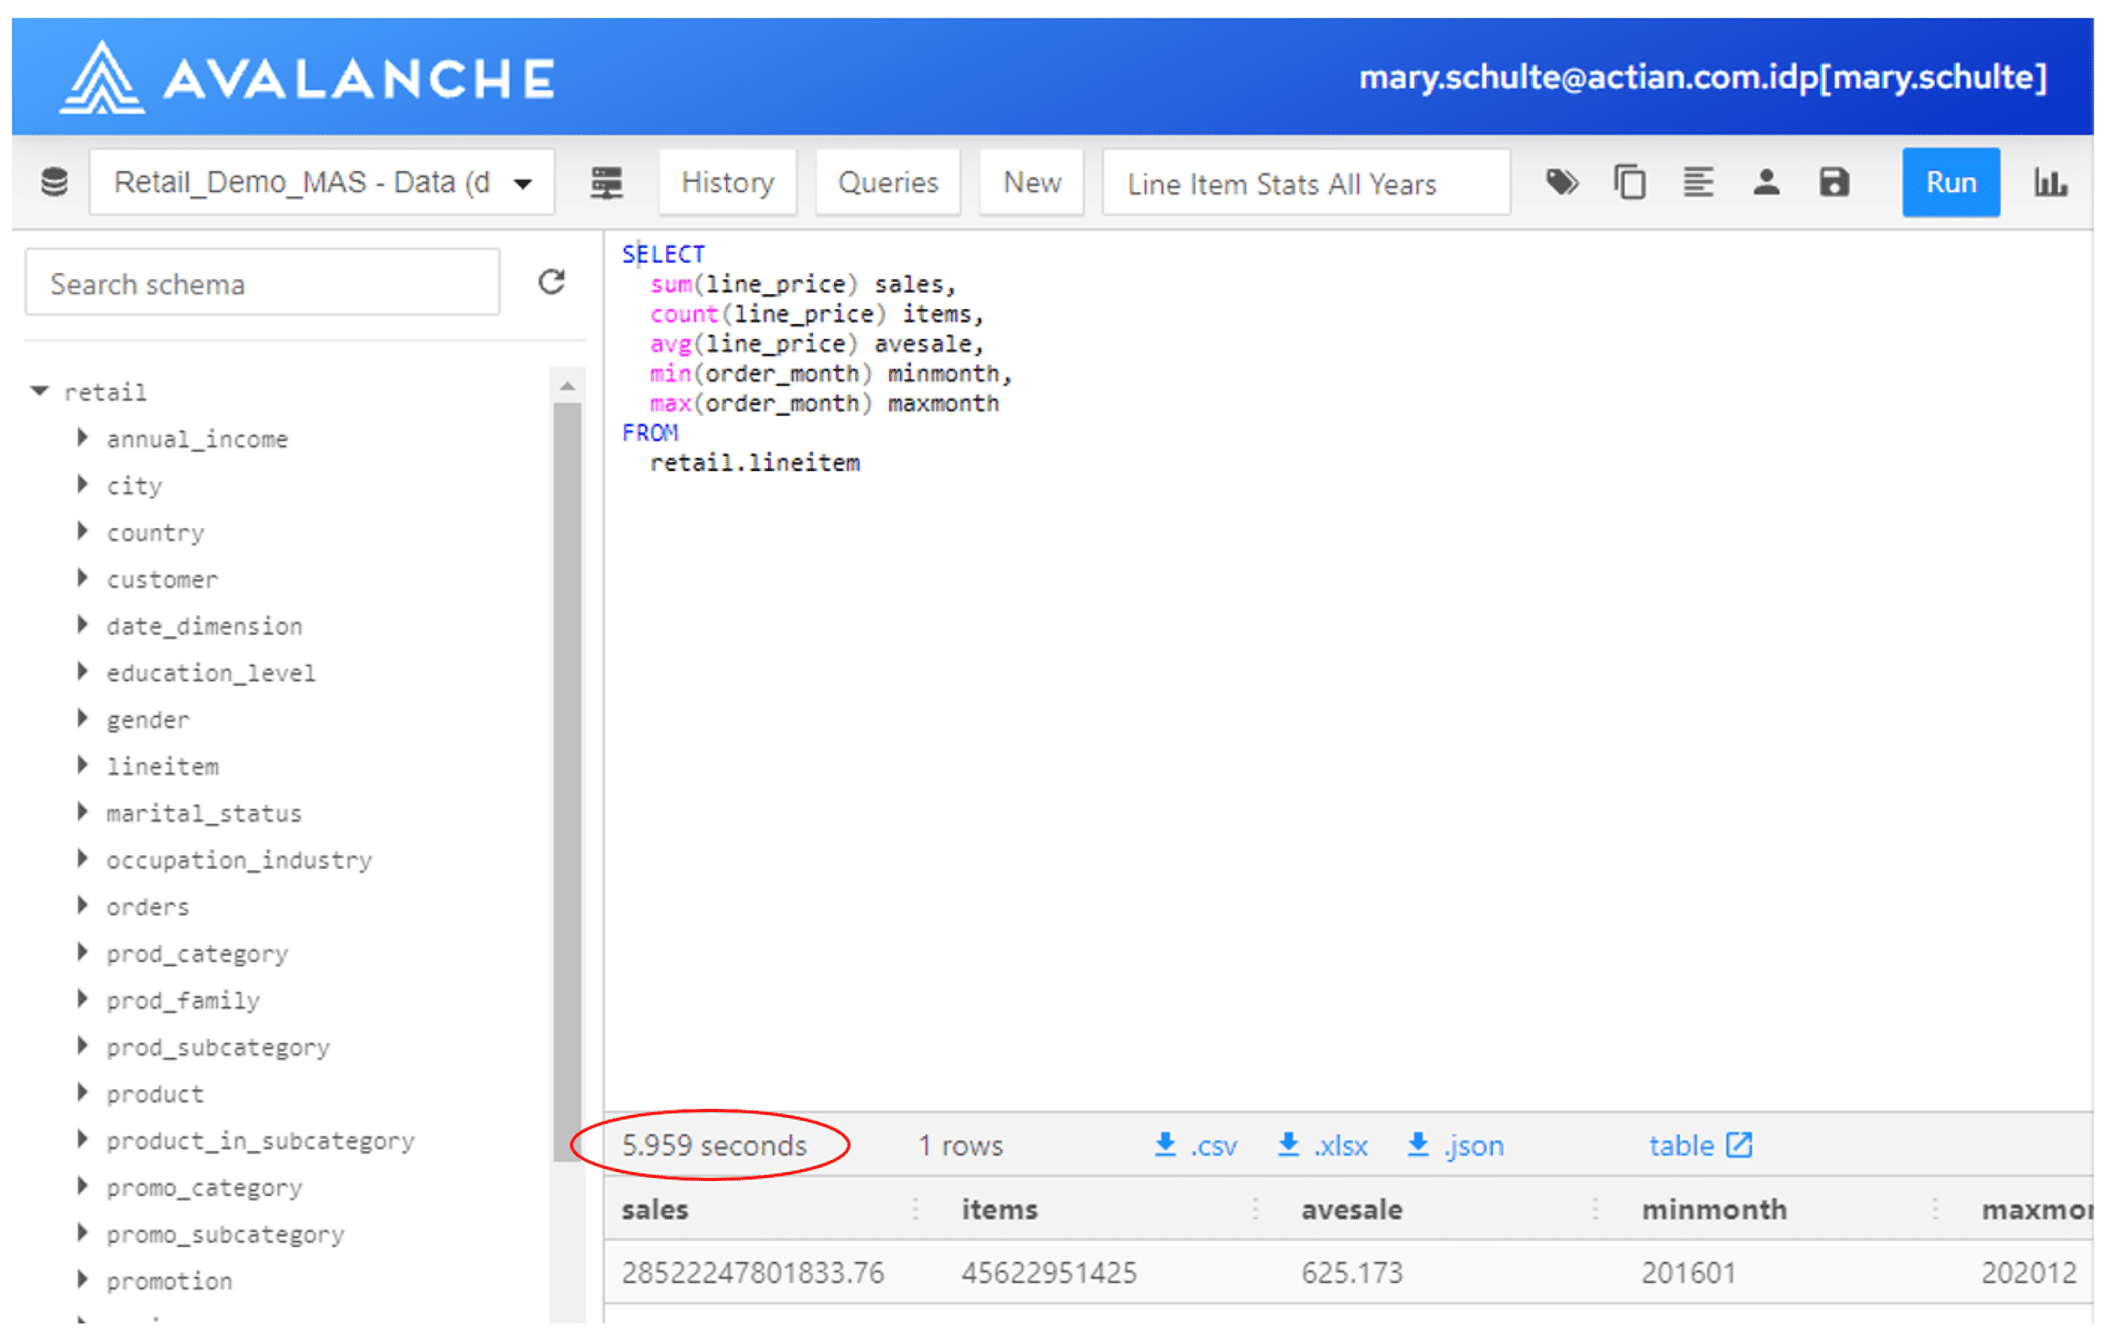
Because of the speed of Actian, in just a few seconds, I gleaned some valuable information from my warehouse. It looks like I have five years’ worth of data including over 45 billion line items sold, showing an average sale of $625. That’s terrific! See Figure 4.
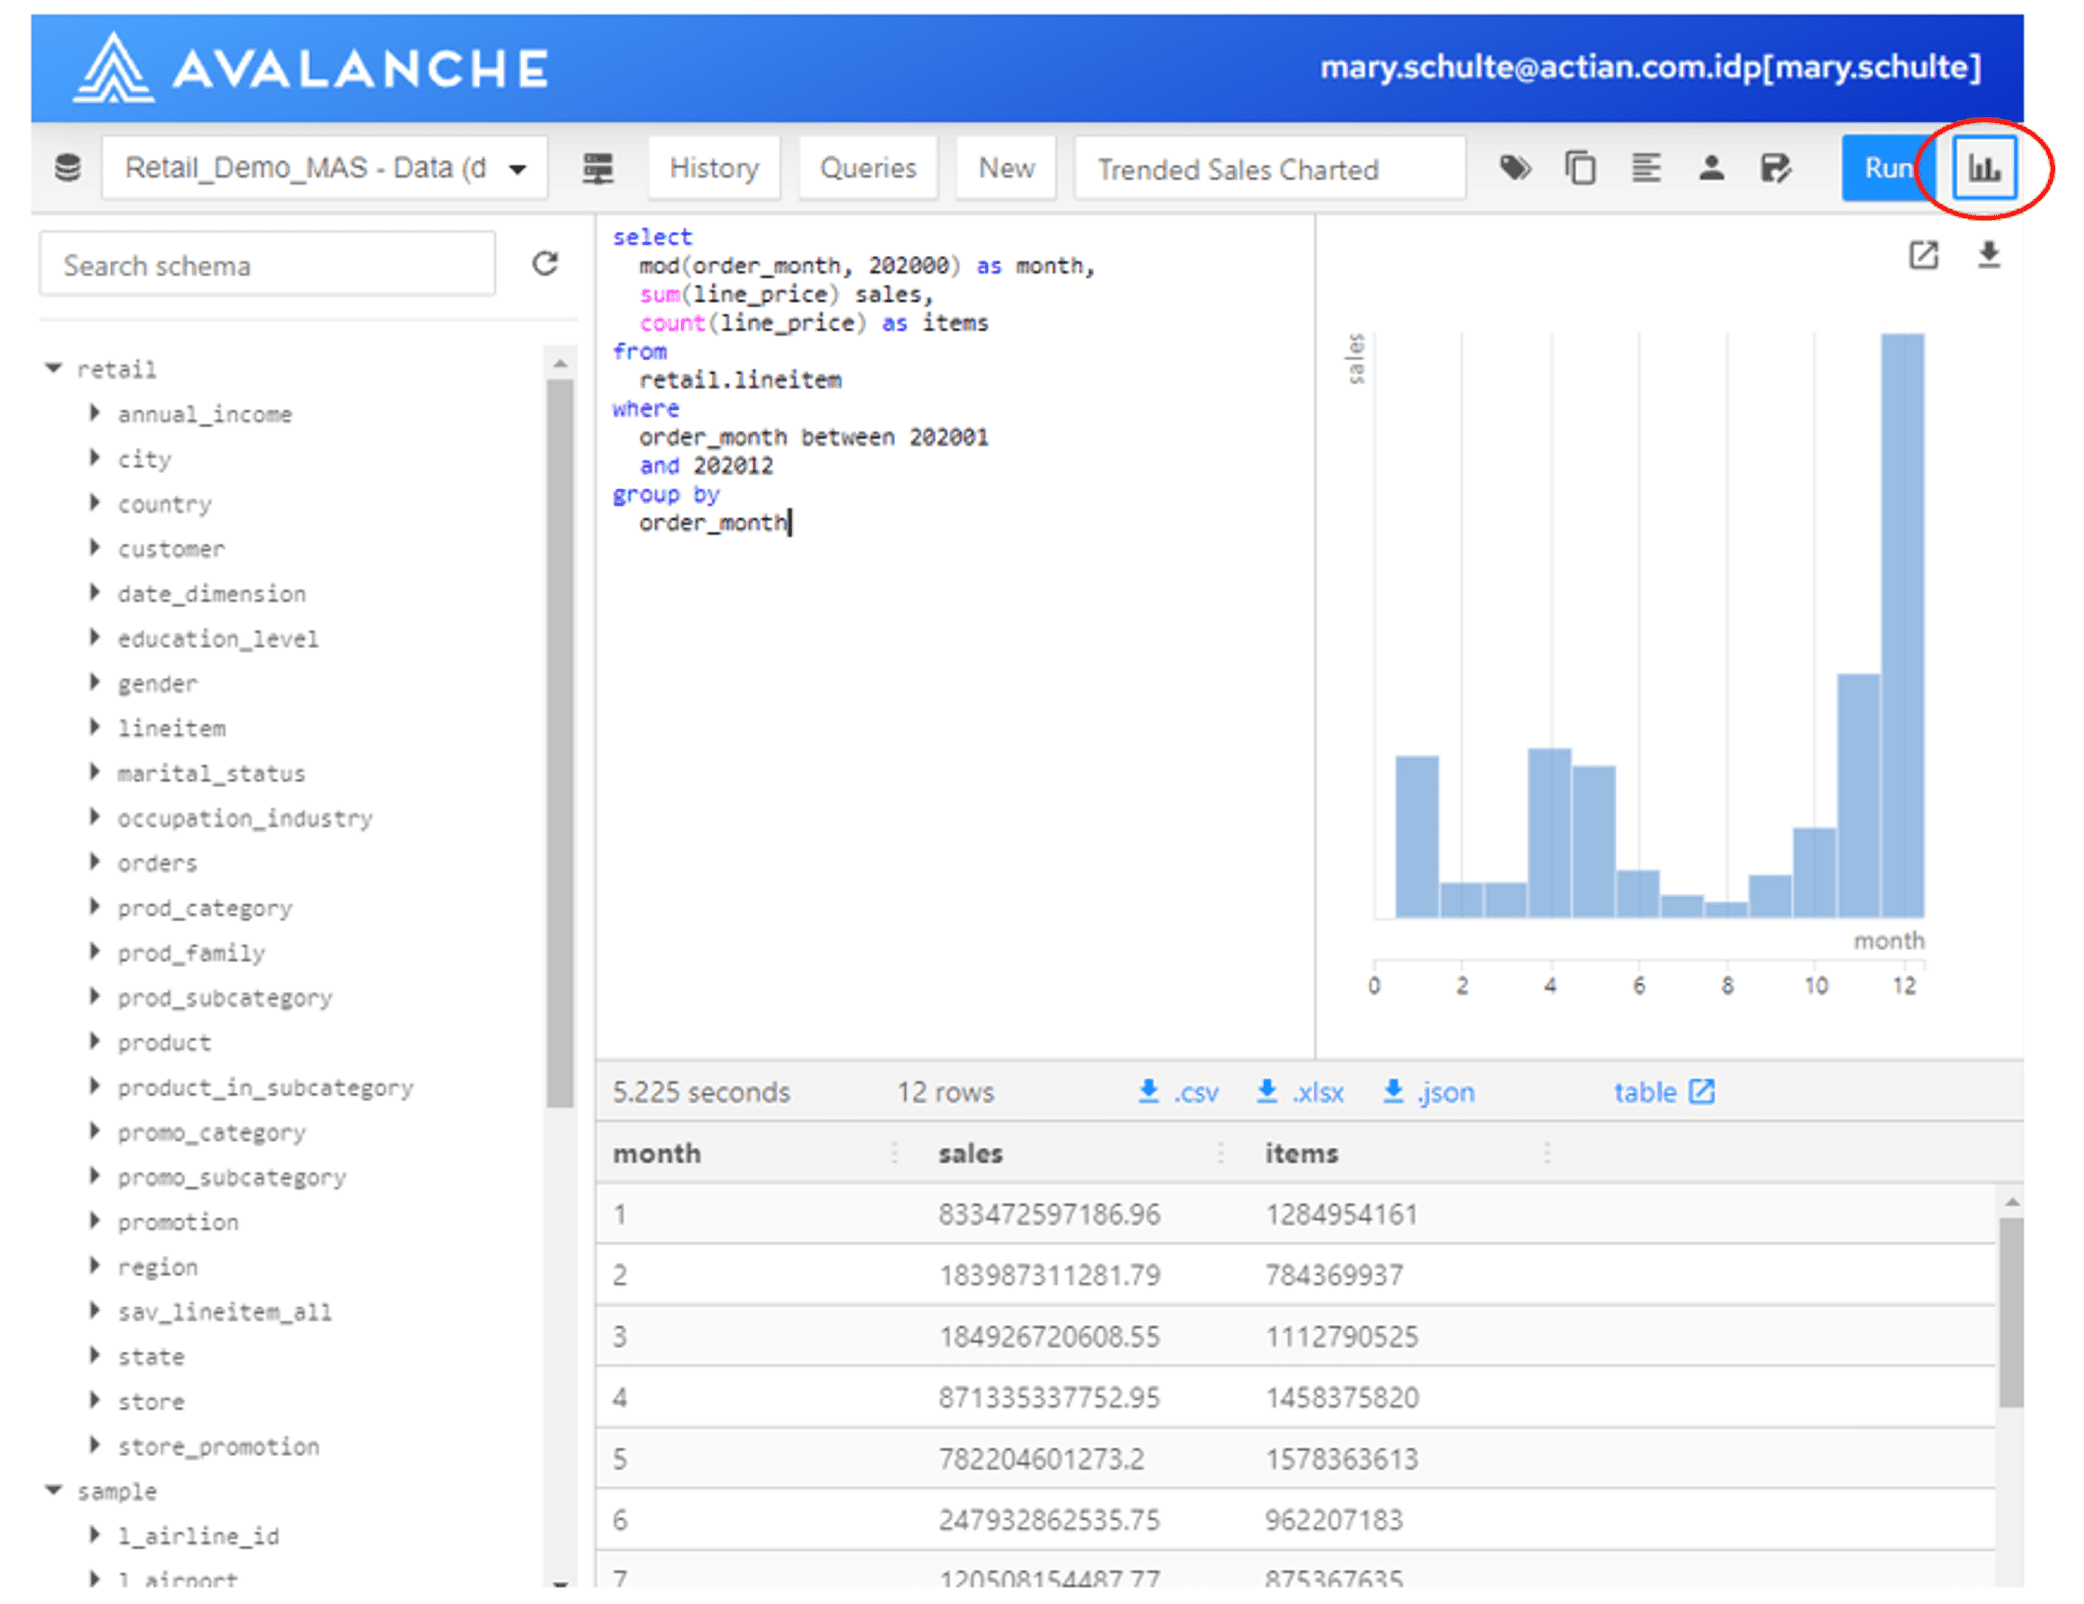
Also, I would like to see trended sales by month. I execute this query:
This query also finished in just a few seconds, but with all these big numbers, it’s a little hard to grasp their relative values. It will be helpful to make a chart using the Actian Query Editor’s charting function.
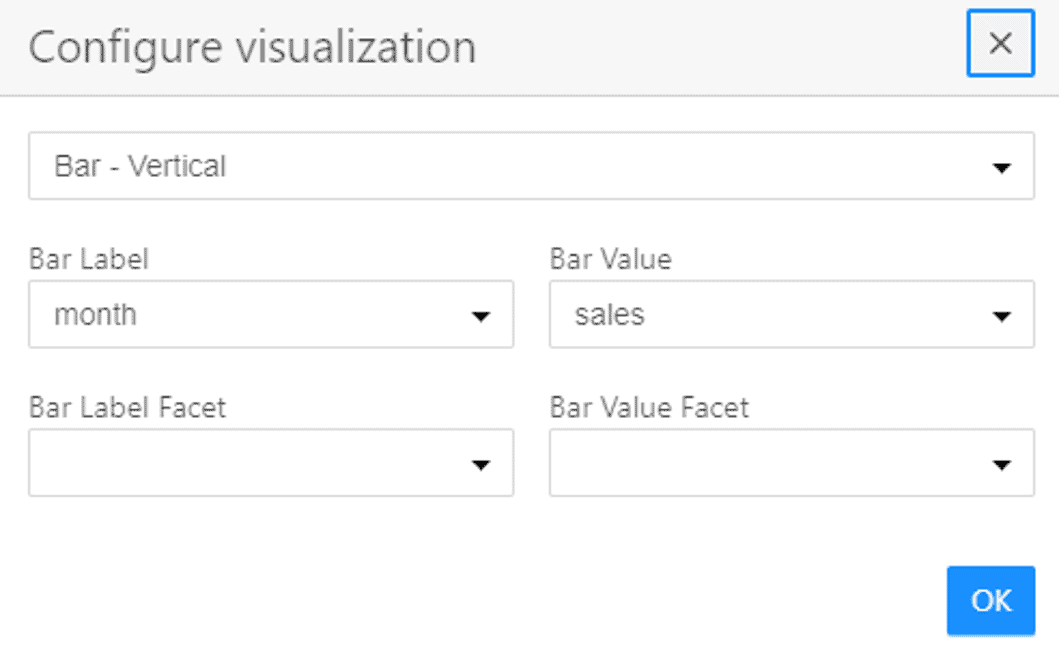
I’ve used the charting function (see Figure 6) to create a bar chart. I’m running the same query essentially, but I’ve simplified it and limited the output to just last year. It’s easy to see now, that my sales really accelerated around Christmas. I’ve shown how I configured this chart in Figure 7.
Find Best-selling Products (A)
Now that I understand my data, I execute this query to find the best-selling product categories by spend in the last year:
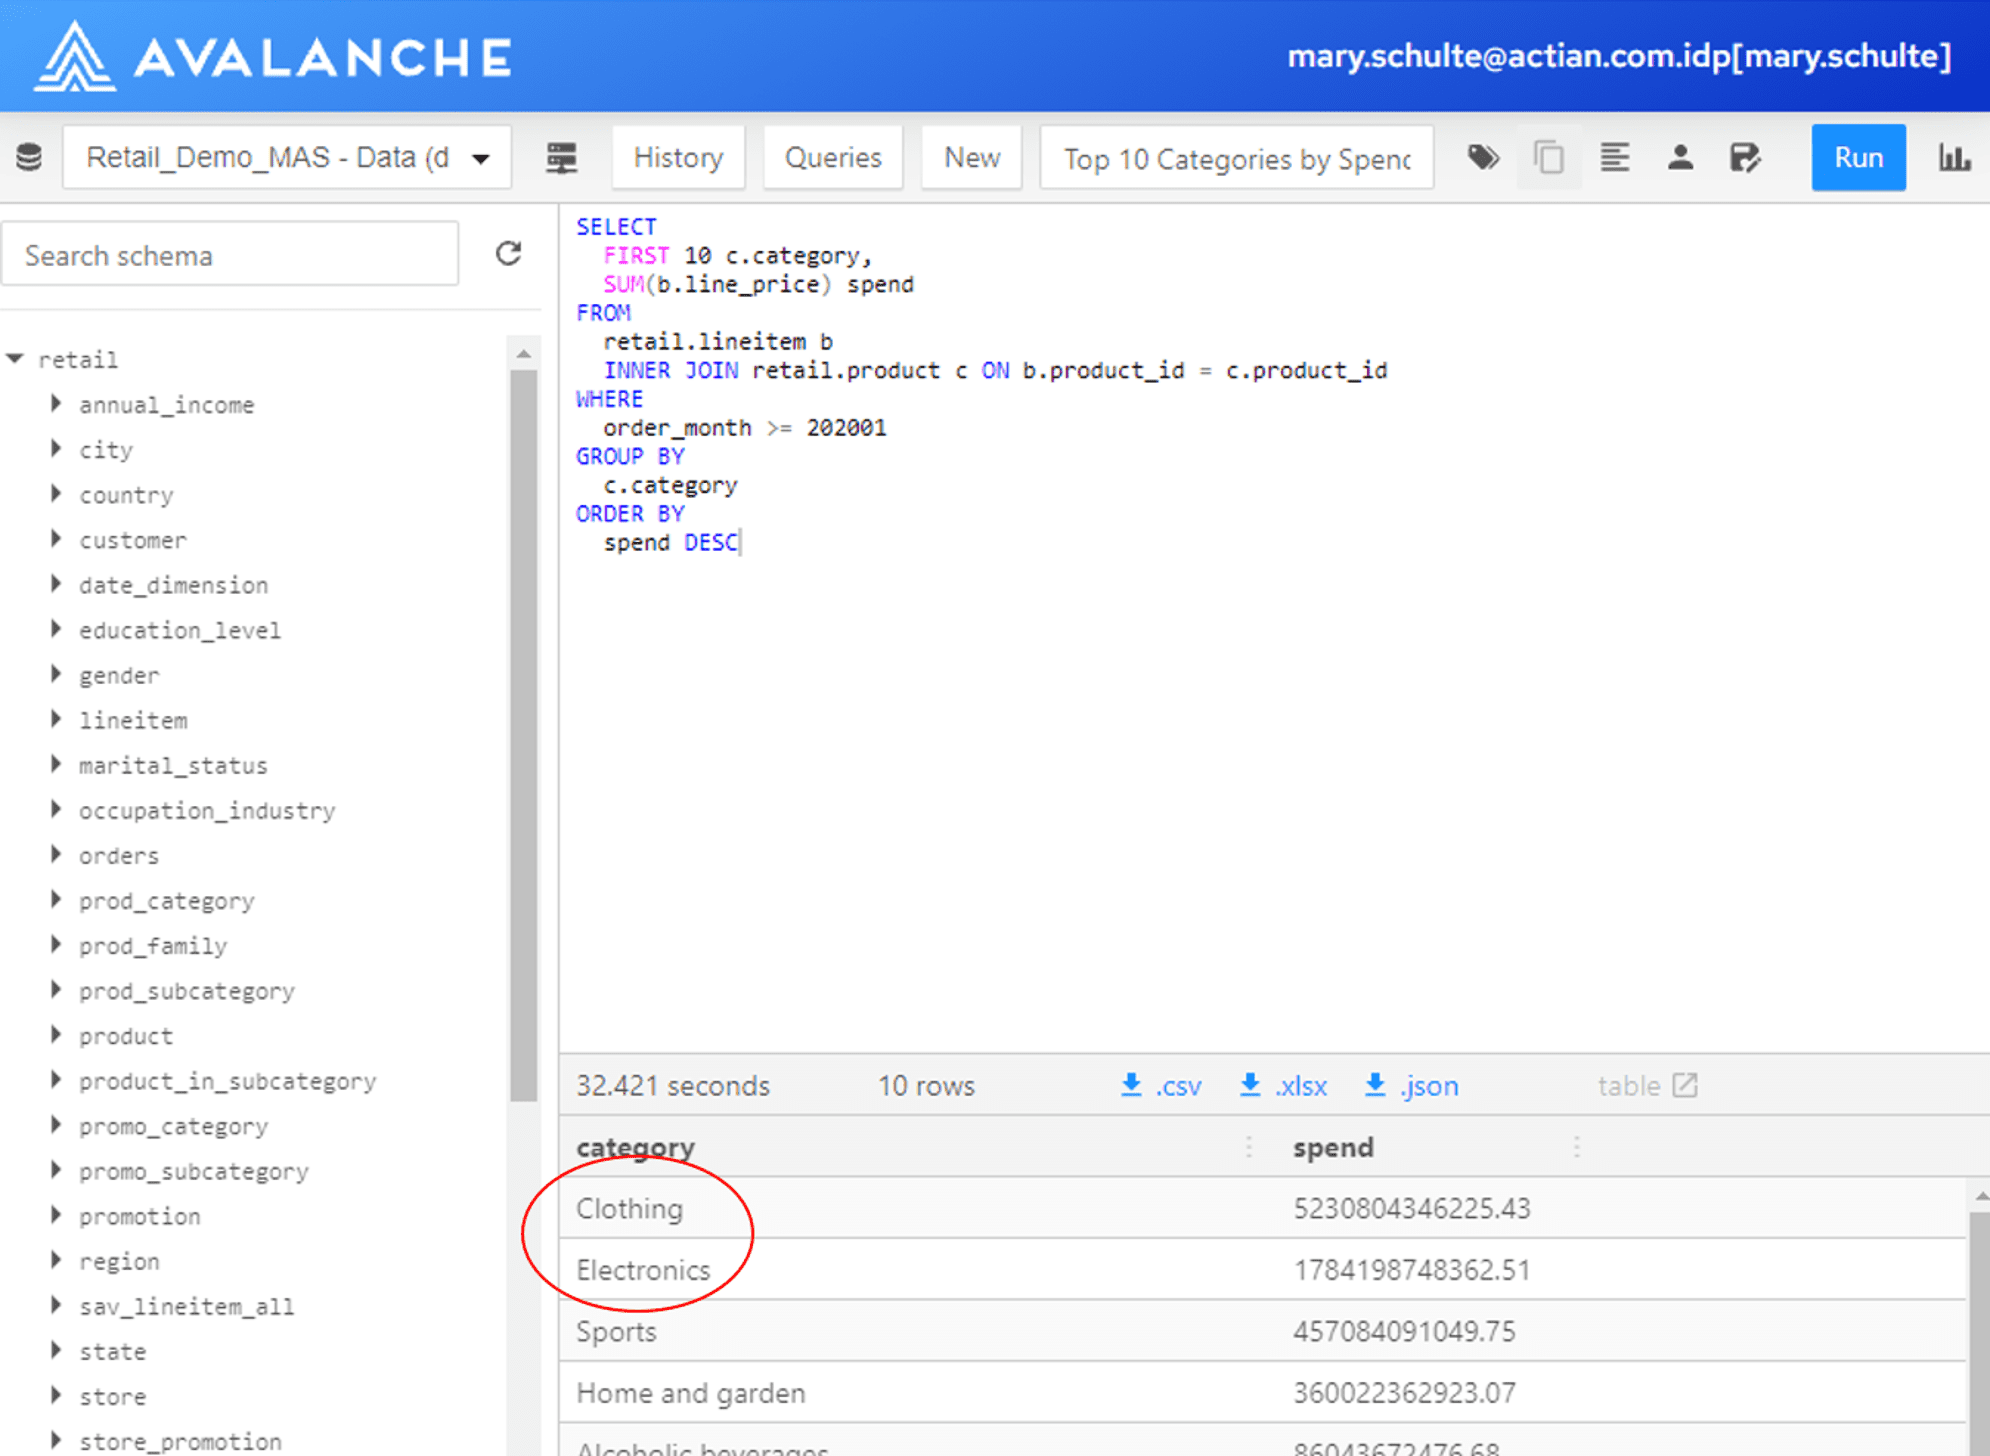
In just a few seconds, I learn that Clothing and Electronics were my best-selling product categories overall. I know that marketing always likes to work with Electronics, so I’m going to concentrate there.
Next, I want to find the top-selling products in Electronics last year. I execute this query:
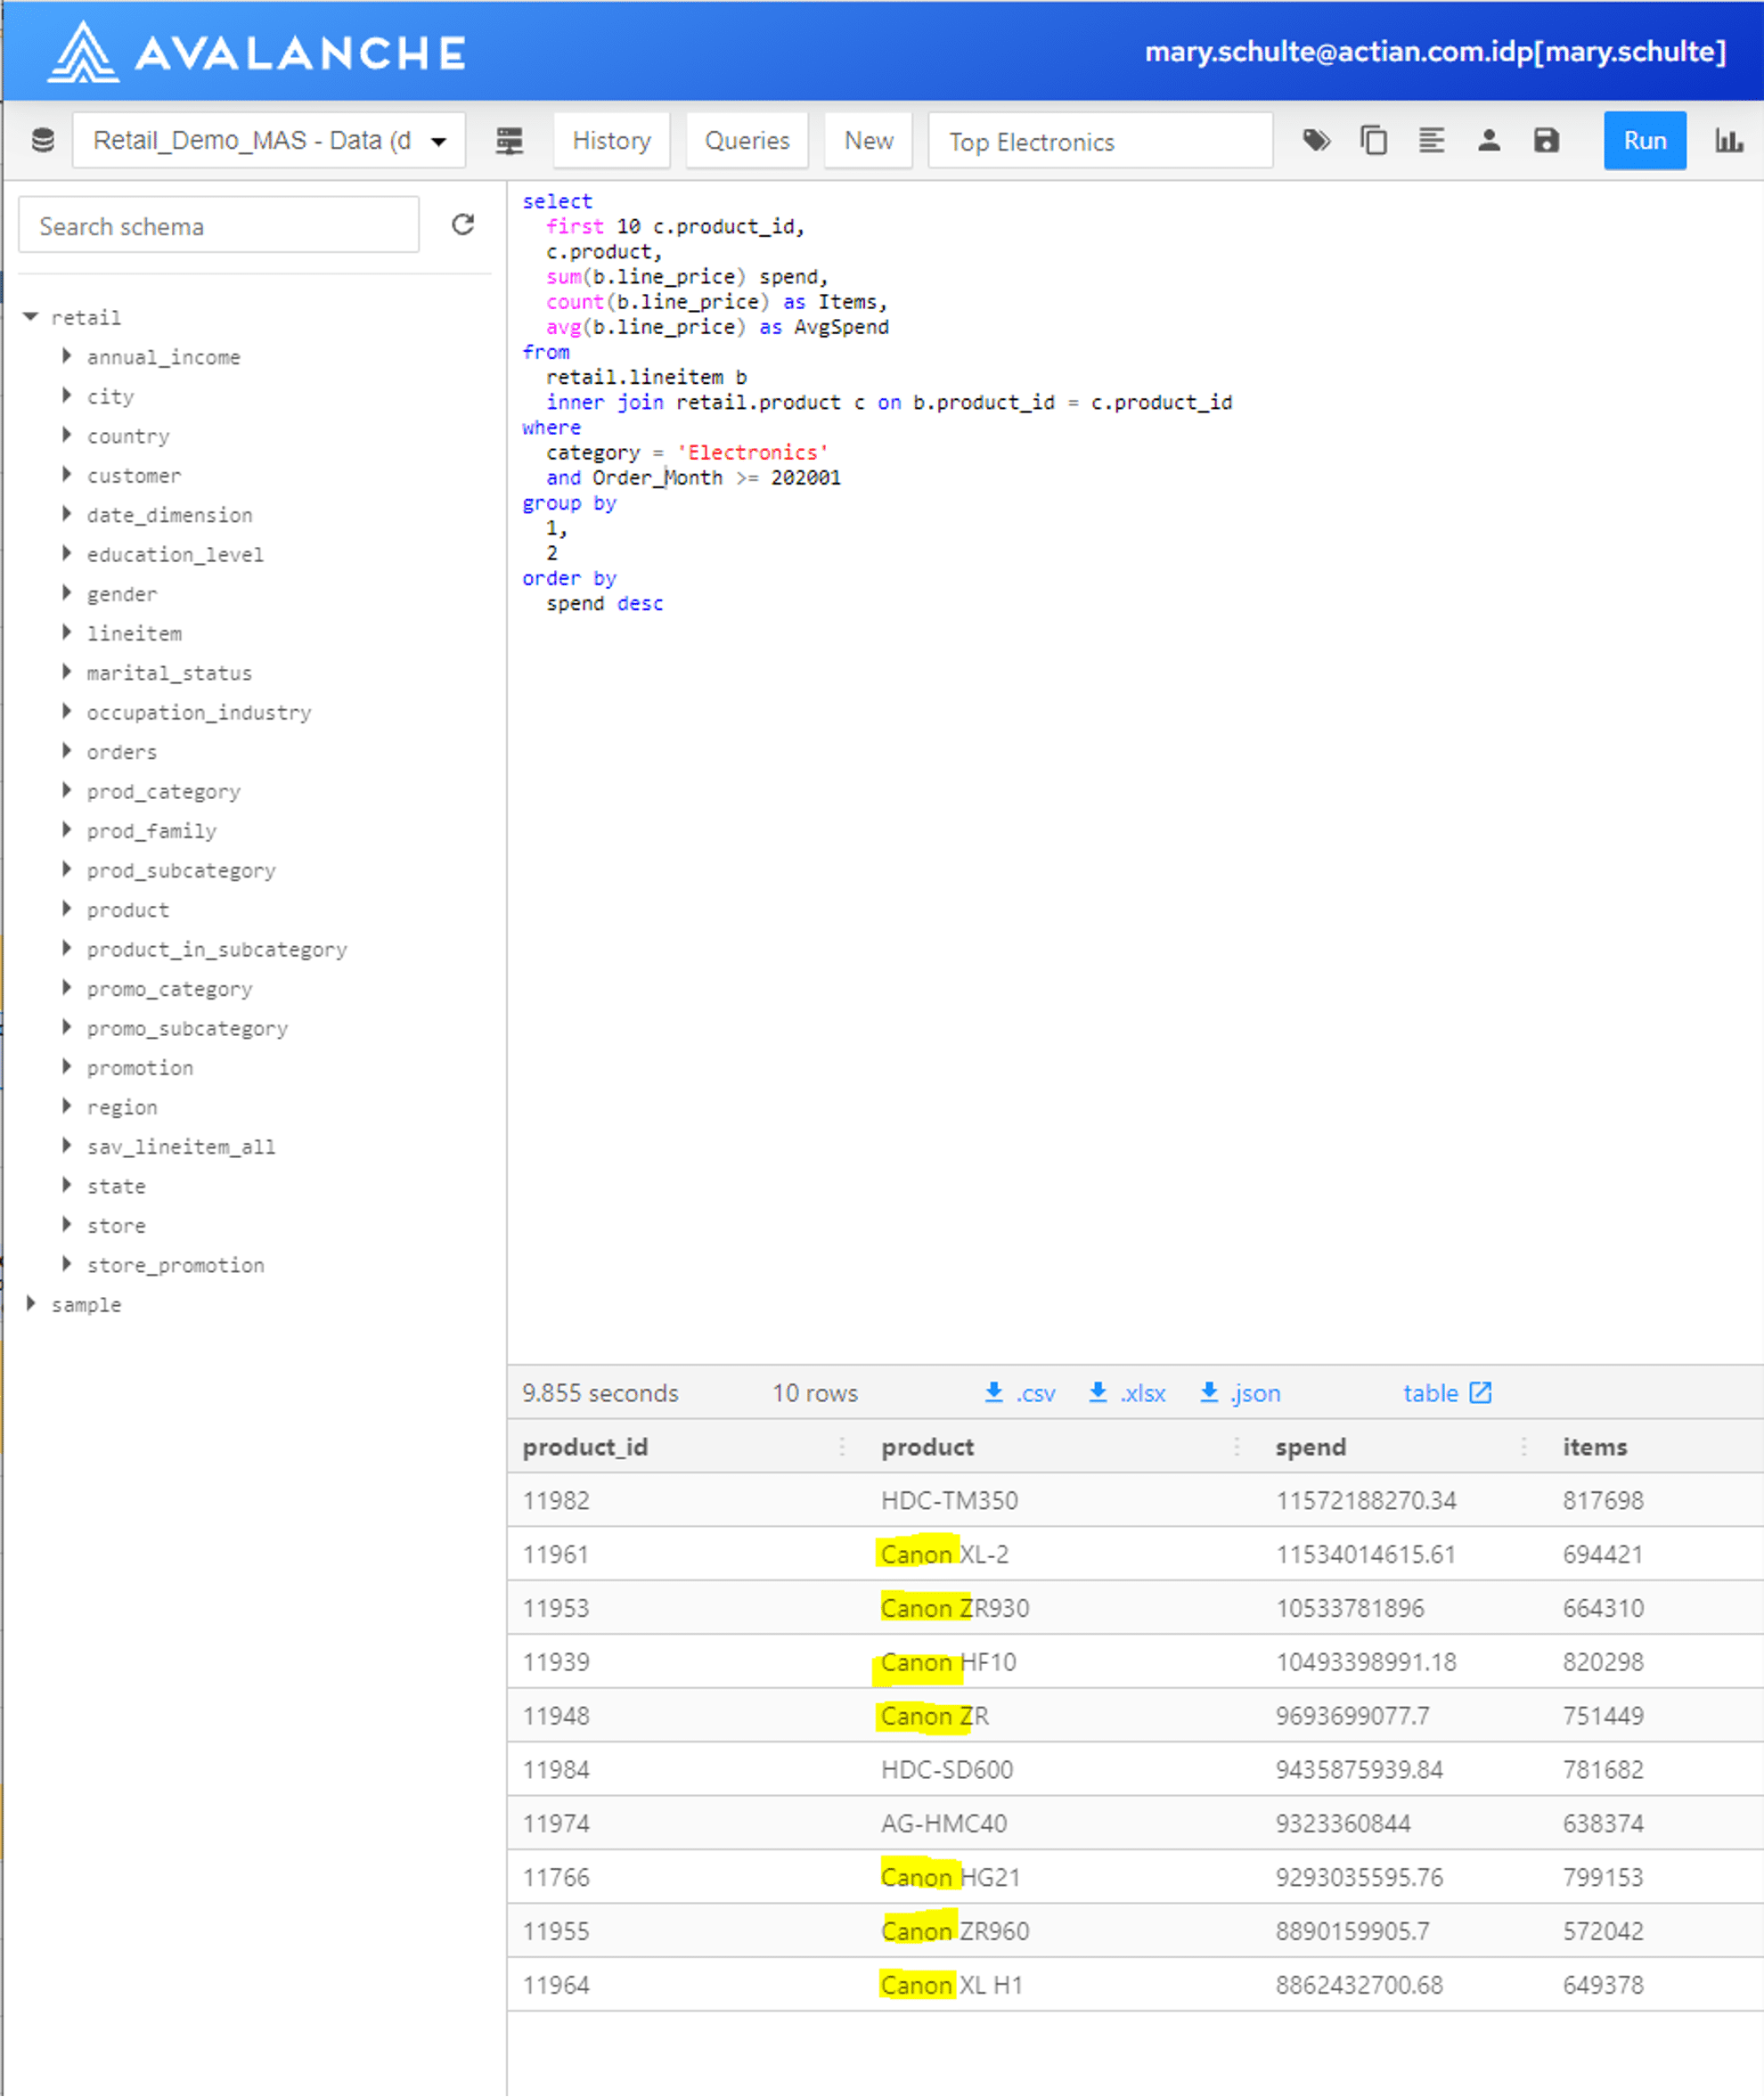
Again, because of the speed of Actian, in a few seconds, I learn that many of the top products in my Electronics category are Canon products. See Figure 9.
Find Products Commonly Sold with Top Products (B)
Now I want to find the Electronics products that are most often sold with these top-selling Canon products in the last six months. This is the resource-intensive market-basket query that I referred to in my introduction. To execute, this query will join my 45 billion line items back to the same 45 billion line items to see which items are typically bought together. I execute this query:
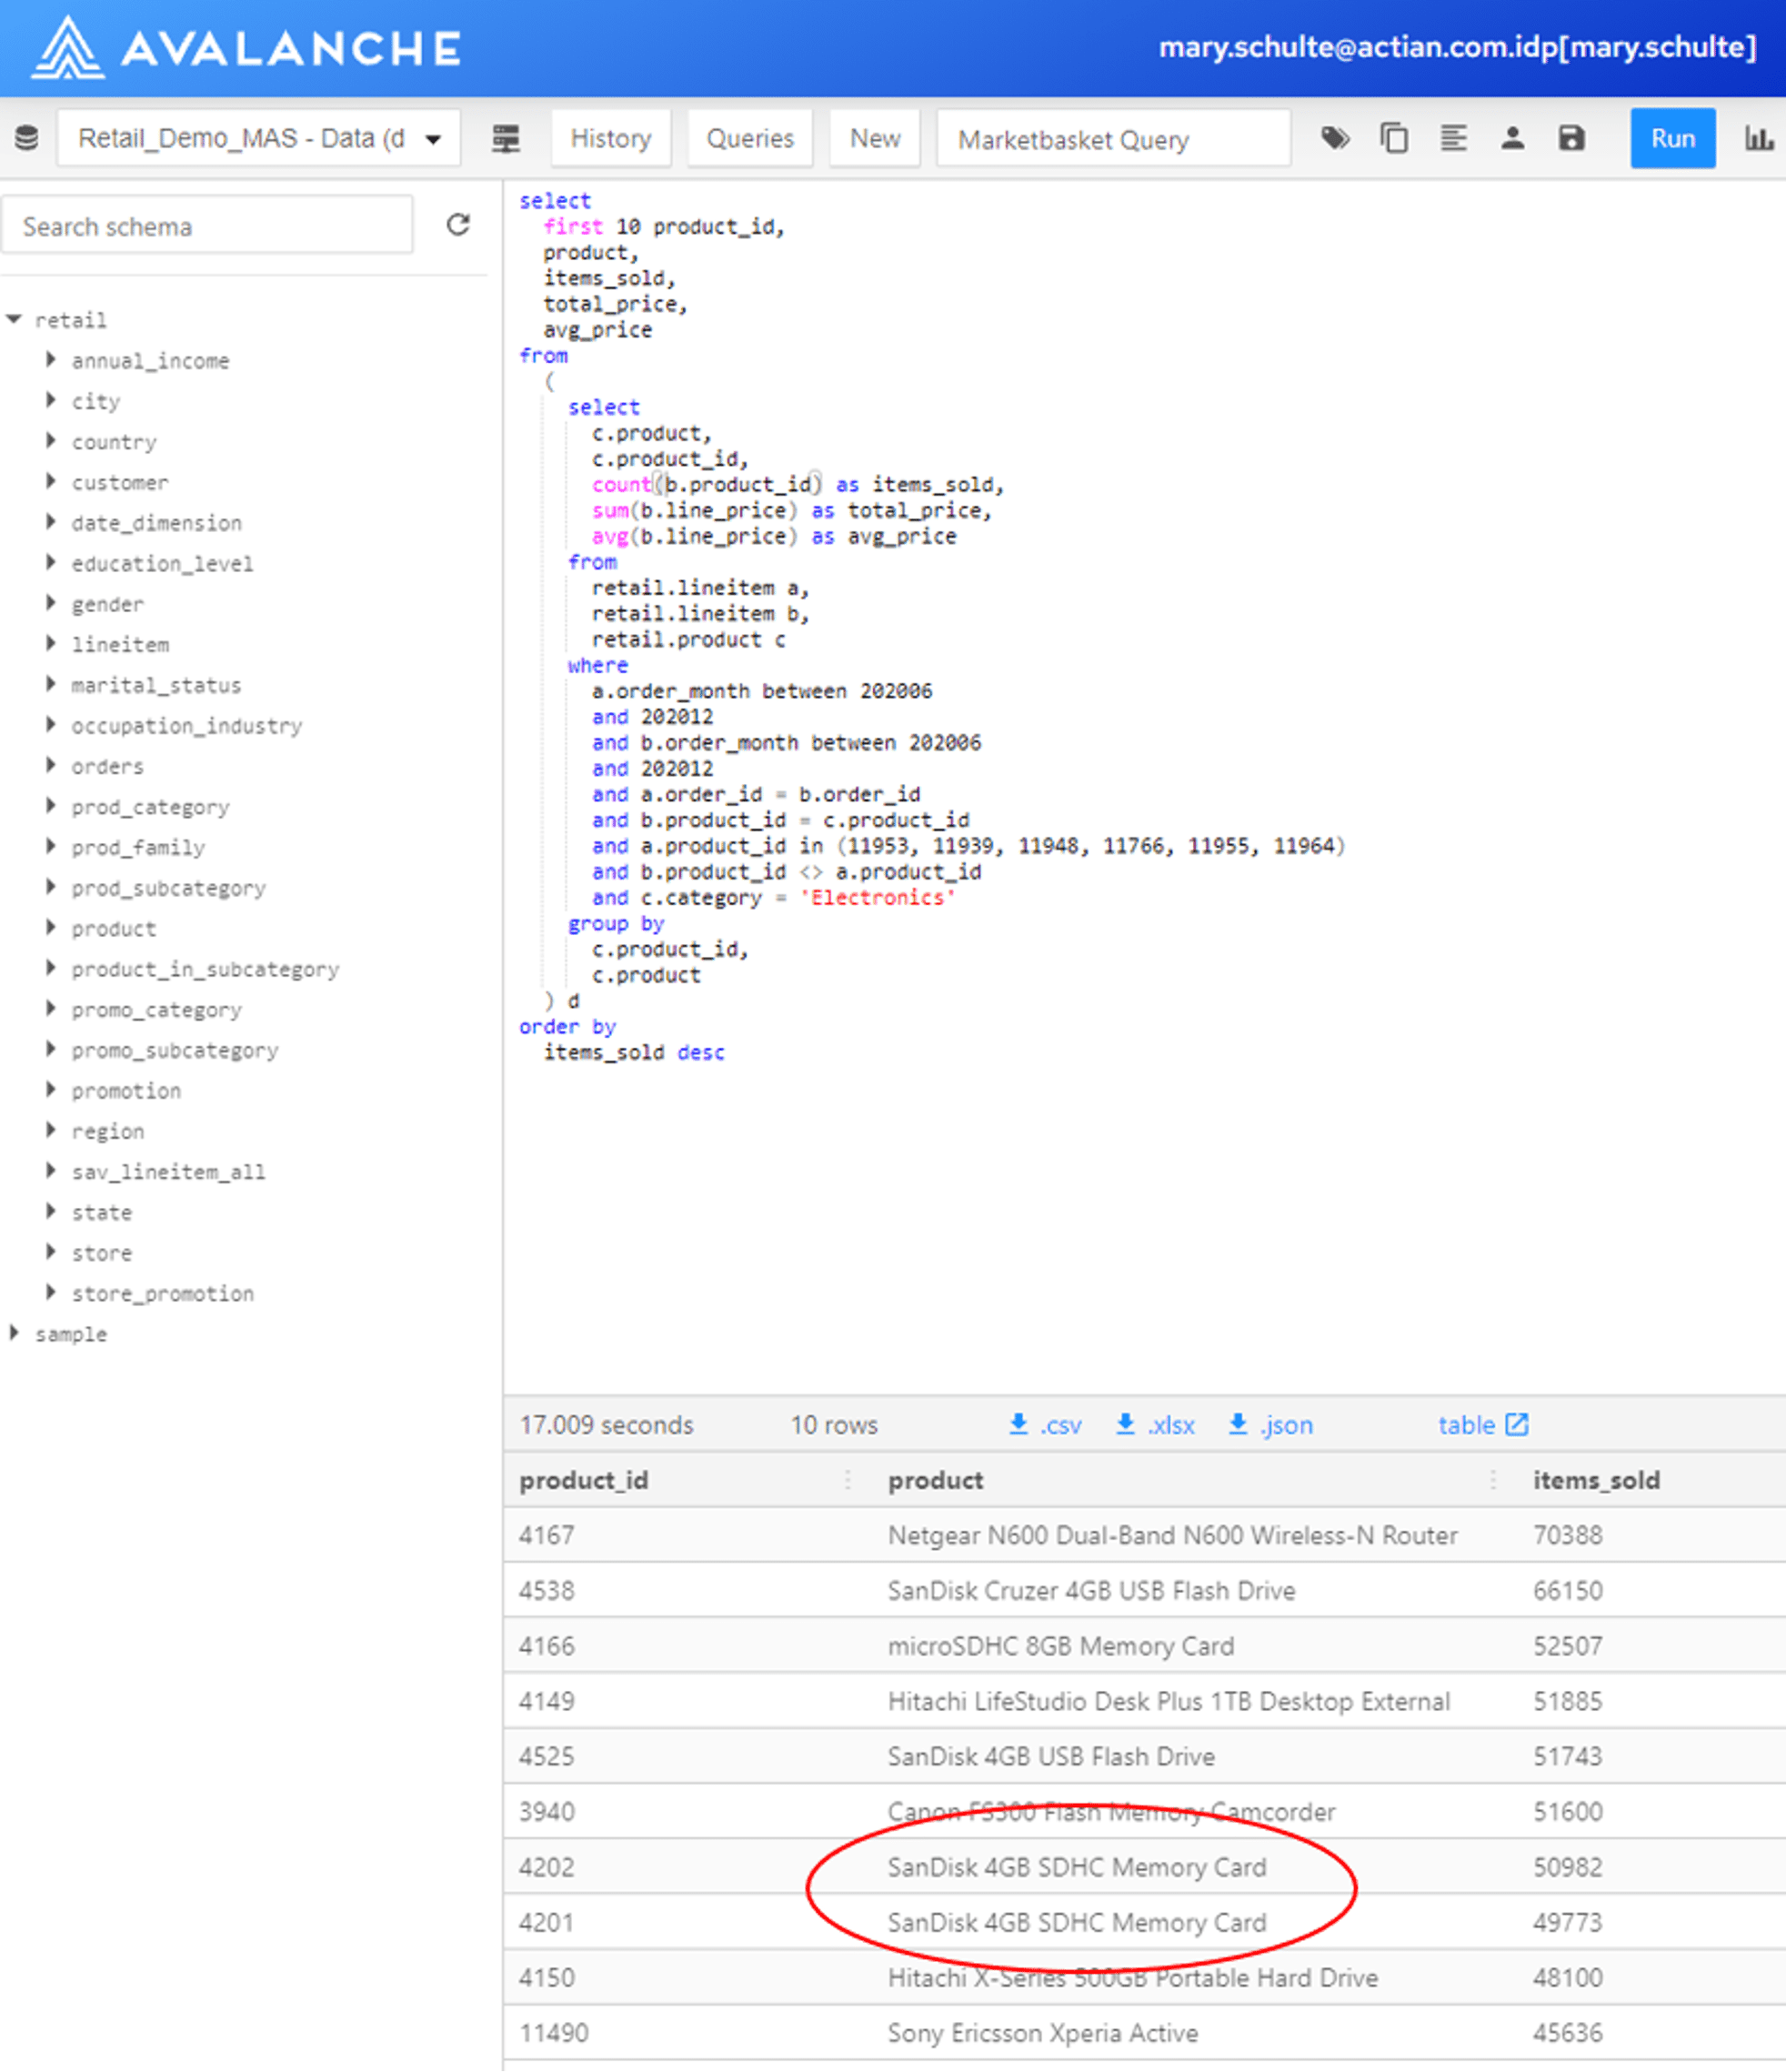
This query is much more complex than the previous queries, still, it only took a mere 17 seconds to execute in Actian. It is obvious from this query that Canon customers often buy SDHC Memory Cards of different types. This is something that seems logical, of course, but I have now proven this with analytics.
Find the Customer Population Who Bought A But Not B
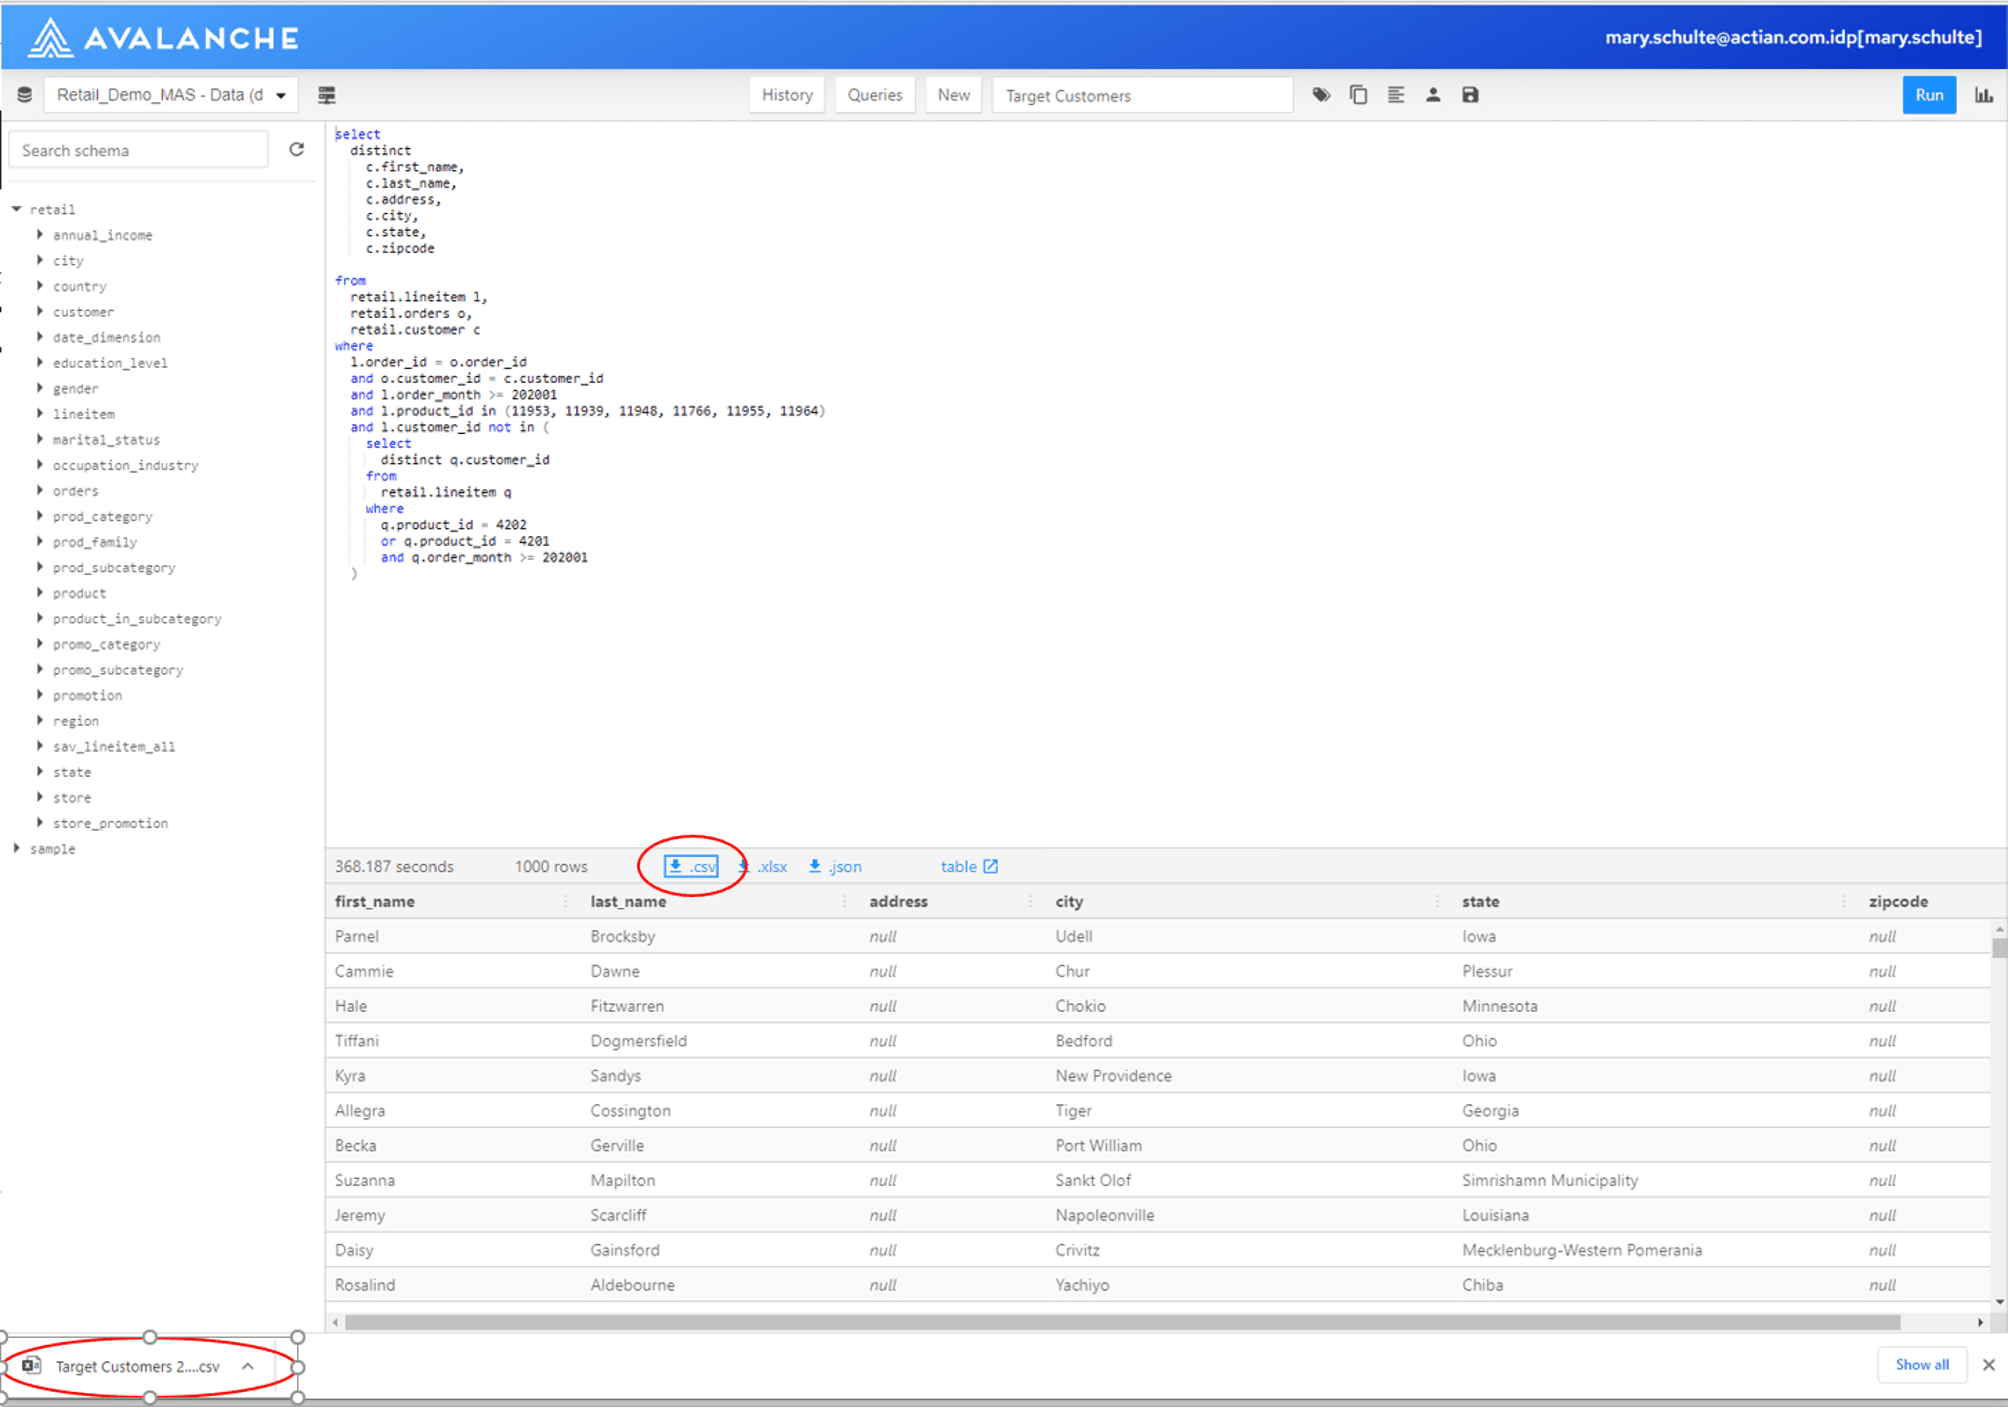
Now I need to find the names and addresses of customers who have NOT bought memory cards. This is basically a reverse market-basket query. Actian will join the 45 billion row line item table back to itself, this time to find missing relationships…customers who have not bought memory cards. It then also needs to join the line item and order information back to the customer table to get the corresponding name and address information. Also, I need to make sure I don’t send duplicate mailings to any customer that may have bought multiple Canon products, so I have added the DISTINCT keyword to my SQL. I execute the query below. Once it is finished, I then choose the .csv download option to create an output file. See the red circles in Figure 11.
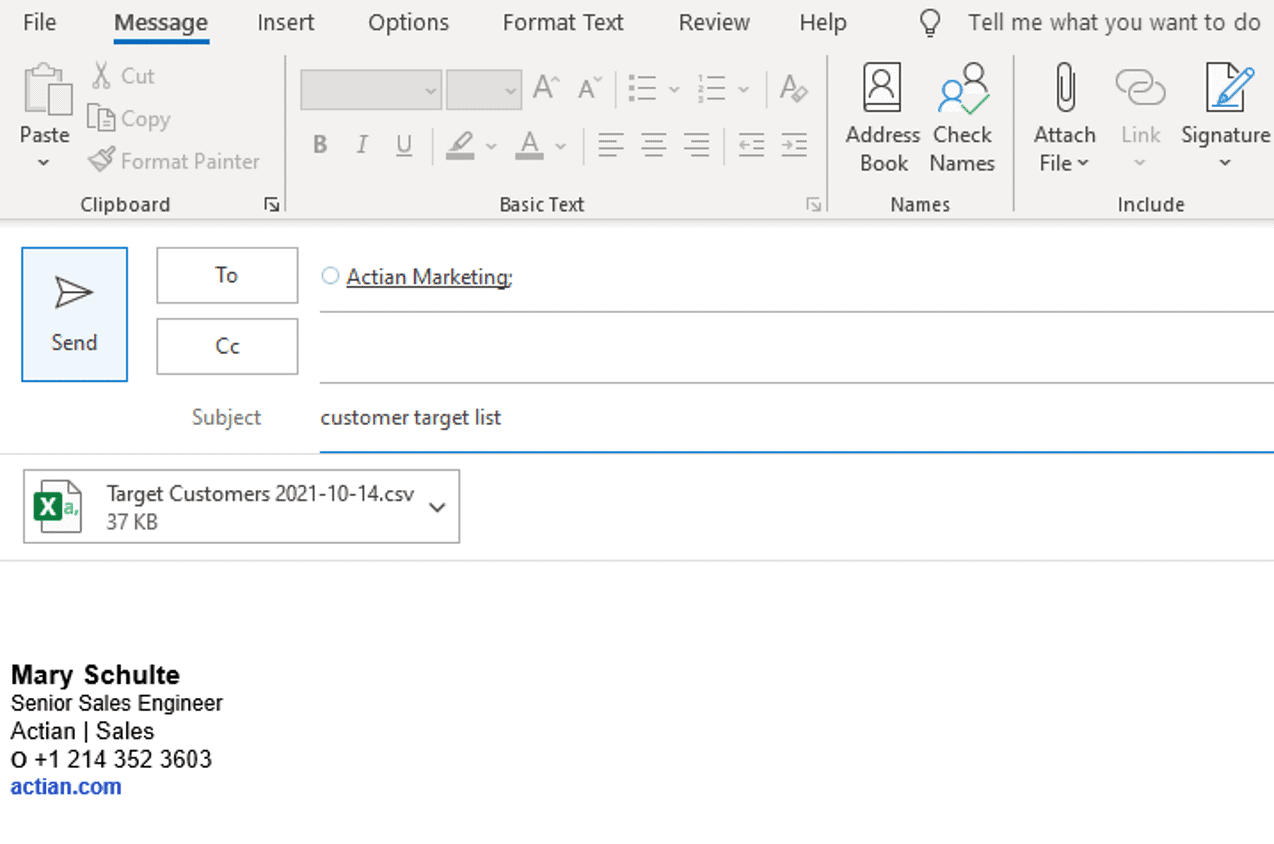
Provide Appropriate Information to Marketing
I can now easily mail the .csv file of prospect customers to market so they can send out their marketing mail campaign.
In conclusion, the Actian Data Warehouse is a very powerful cloud data warehouse platform that also includes the basic tools and speed you need to be productive with affinity analytics in your business.
You can download a full-function free trial of Actian and see what affinities you can find in your own data!
Subscribe to the Actian Blog
Subscribe to Actian’s blog to get data insights delivered right to you.
- Stay in the know – Get the latest in data analytics pushed directly to your inbox
- Never miss a post – You’ll receive automatic email updates to let you know when new posts are live
- It’s all up to you – Change your delivery preferences to suit your needs